Latvian vs Estonian Currently Married
COMPARE
Latvian
Estonian
Currently Married
Currently Married Comparison
Latvians
Estonians
48.5%
CURRENTLY MARRIED
98.7/ 100
METRIC RATING
56th/ 347
METRIC RANK
48.2%
CURRENTLY MARRIED
97.4/ 100
METRIC RATING
74th/ 347
METRIC RANK
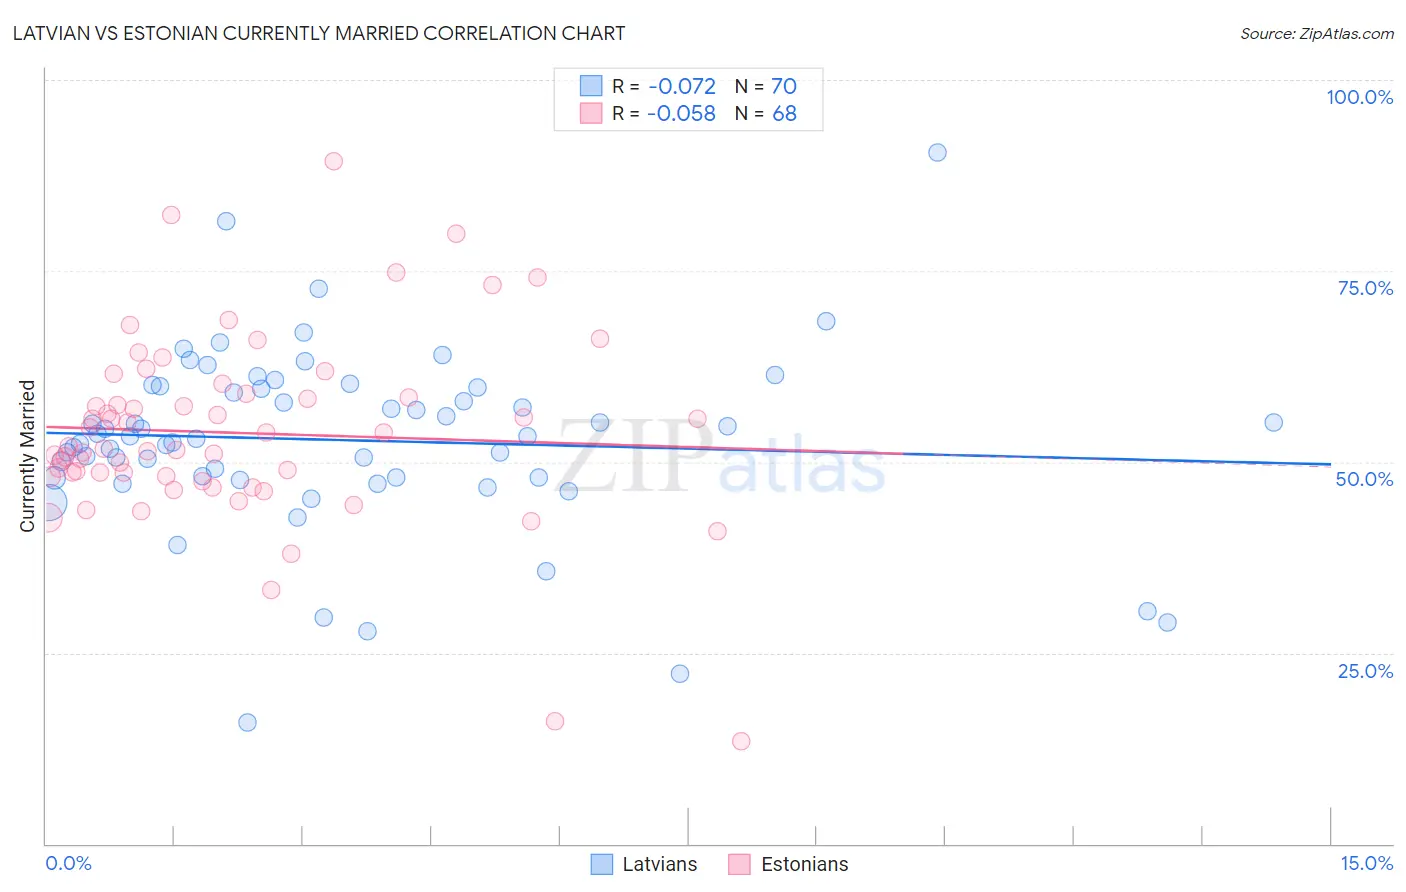
Latvian vs Estonian Currently Married Correlation Chart
The statistical analysis conducted on geographies consisting of 220,695,418 people shows a slight negative correlation between the proportion of Latvians and percentage of population currently married in the United States with a correlation coefficient (R) of -0.072 and weighted average of 48.5%. Similarly, the statistical analysis conducted on geographies consisting of 123,509,767 people shows a slight negative correlation between the proportion of Estonians and percentage of population currently married in the United States with a correlation coefficient (R) of -0.058 and weighted average of 48.2%, a difference of 0.60%.
Currently Married Correlation Summary
| Measurement | Latvian | Estonian |
| Minimum | 15.8% | 13.5% |
| Maximum | 90.5% | 89.3% |
| Range | 74.7% | 75.8% |
| Mean | 52.8% | 53.8% |
| Median | 53.4% | 51.9% |
| Interquartile 25% (IQ1) | 47.9% | 48.1% |
| Interquartile 75% (IQ3) | 59.7% | 58.7% |
| Interquartile Range (IQR) | 11.8% | 10.6% |
| Standard Deviation (Sample) | 12.1% | 12.4% |
| Standard Deviation (Population) | 12.0% | 12.3% |
Demographics Similar to Latvians and Estonians by Currently Married
In terms of currently married, the demographic groups most similar to Latvians are Immigrants from North Macedonia (48.5%, a difference of 0.0%), Immigrants from Netherlands (48.5%, a difference of 0.030%), French (48.4%, a difference of 0.070%), Immigrants from Ireland (48.4%, a difference of 0.10%), and Immigrants from Romania (48.4%, a difference of 0.11%). Similarly, the demographic groups most similar to Estonians are Immigrants from Eastern Asia (48.2%, a difference of 0.030%), Immigrants from Lebanon (48.2%, a difference of 0.050%), Immigrants from Belarus (48.1%, a difference of 0.070%), Immigrants from Asia (48.3%, a difference of 0.20%), and Macedonian (48.3%, a difference of 0.20%).
| Demographics | Rating | Rank | Currently Married |
| Immigrants | North Macedonia | 98.7 /100 | #55 | Exceptional 48.5% |
| Latvians | 98.7 /100 | #56 | Exceptional 48.5% |
| Immigrants | Netherlands | 98.6 /100 | #57 | Exceptional 48.5% |
| French | 98.6 /100 | #58 | Exceptional 48.4% |
| Immigrants | Ireland | 98.5 /100 | #59 | Exceptional 48.4% |
| Immigrants | Romania | 98.5 /100 | #60 | Exceptional 48.4% |
| Romanians | 98.5 /100 | #61 | Exceptional 48.4% |
| Asians | 98.5 /100 | #62 | Exceptional 48.4% |
| Slavs | 98.3 /100 | #63 | Exceptional 48.4% |
| Immigrants | Czechoslovakia | 98.3 /100 | #64 | Exceptional 48.4% |
| Ukrainians | 98.3 /100 | #65 | Exceptional 48.4% |
| Tongans | 98.2 /100 | #66 | Exceptional 48.3% |
| Slovaks | 98.2 /100 | #67 | Exceptional 48.3% |
| Immigrants | England | 98.2 /100 | #68 | Exceptional 48.3% |
| Canadians | 98.1 /100 | #69 | Exceptional 48.3% |
| Immigrants | Asia | 97.9 /100 | #70 | Exceptional 48.3% |
| Macedonians | 97.9 /100 | #71 | Exceptional 48.3% |
| Immigrants | Lebanon | 97.6 /100 | #72 | Exceptional 48.2% |
| Immigrants | Eastern Asia | 97.5 /100 | #73 | Exceptional 48.2% |
| Estonians | 97.4 /100 | #74 | Exceptional 48.2% |
| Immigrants | Belarus | 97.2 /100 | #75 | Exceptional 48.1% |