Latvian vs Central American Indian Births to Unmarried Women
COMPARE
Latvian
Central American Indian
Births to Unmarried Women
Births to Unmarried Women Comparison
Latvians
Central American Indians
27.7%
BIRTHS TO UNMARRIED WOMEN
99.5/ 100
METRIC RATING
45th/ 347
METRIC RANK
39.0%
BIRTHS TO UNMARRIED WOMEN
0.0/ 100
METRIC RATING
306th/ 347
METRIC RANK
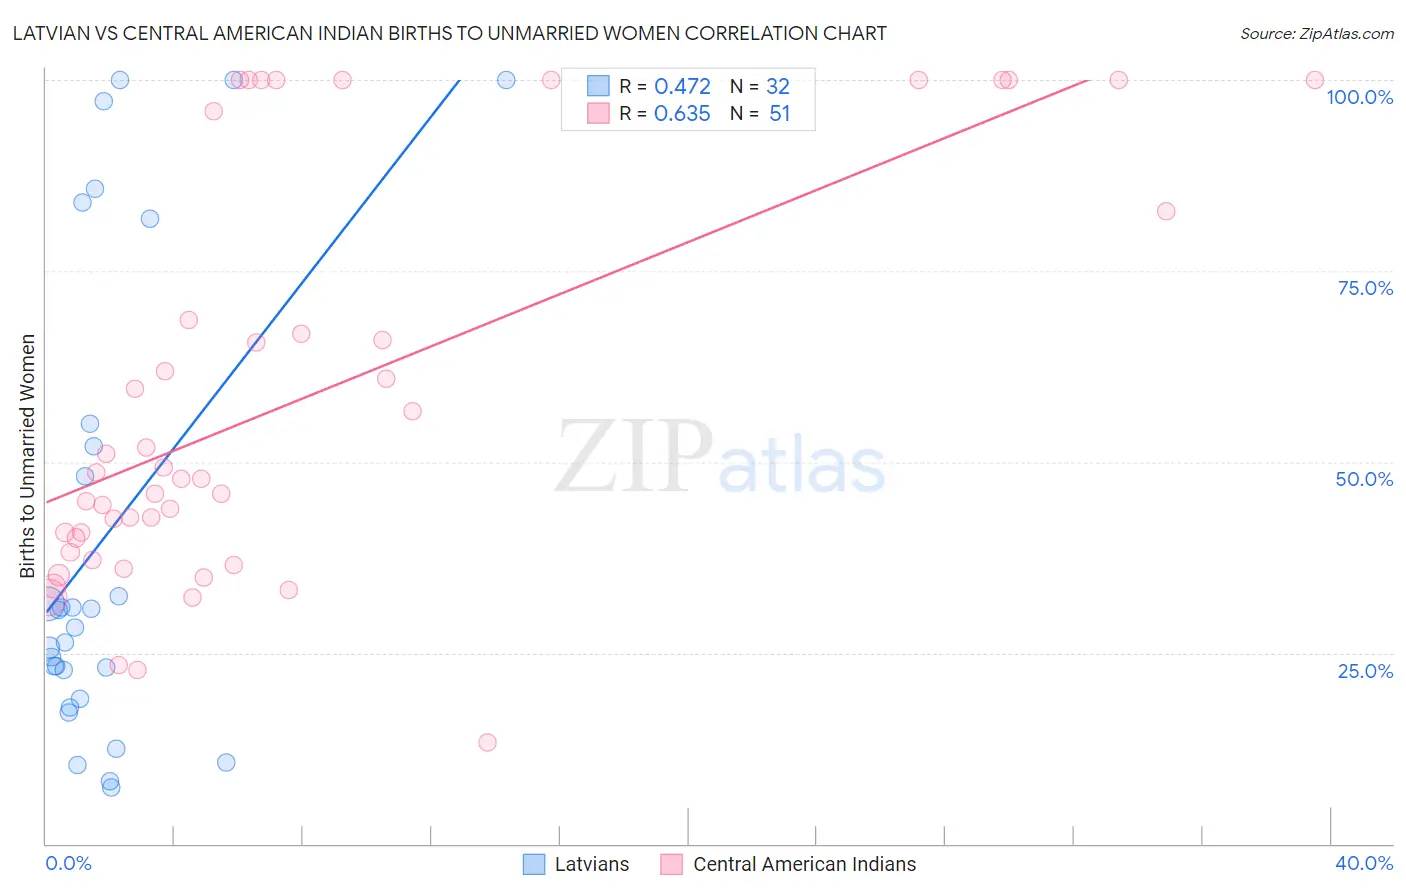
Latvian vs Central American Indian Births to Unmarried Women Correlation Chart
The statistical analysis conducted on geographies consisting of 206,794,611 people shows a moderate positive correlation between the proportion of Latvians and percentage of births to unmarried women in the United States with a correlation coefficient (R) of 0.472 and weighted average of 27.7%. Similarly, the statistical analysis conducted on geographies consisting of 312,295,500 people shows a significant positive correlation between the proportion of Central American Indians and percentage of births to unmarried women in the United States with a correlation coefficient (R) of 0.635 and weighted average of 39.0%, a difference of 40.6%.
Births to Unmarried Women Correlation Summary
| Measurement | Latvian | Central American Indian |
| Minimum | 7.4% | 13.2% |
| Maximum | 100.0% | 100.0% |
| Range | 92.6% | 86.8% |
| Mean | 40.3% | 58.1% |
| Median | 29.5% | 47.9% |
| Interquartile 25% (IQ1) | 20.8% | 38.2% |
| Interquartile 75% (IQ3) | 53.6% | 82.8% |
| Interquartile Range (IQR) | 32.7% | 44.6% |
| Standard Deviation (Sample) | 30.4% | 26.3% |
| Standard Deviation (Population) | 29.9% | 26.0% |
Similar Demographics by Births to Unmarried Women
Demographics Similar to Latvians by Births to Unmarried Women
In terms of births to unmarried women, the demographic groups most similar to Latvians are Immigrants from Lithuania (27.7%, a difference of 0.040%), Hmong (27.7%, a difference of 0.040%), Eastern European (27.7%, a difference of 0.060%), Immigrants from Indonesia (27.7%, a difference of 0.090%), and Immigrants from Greece (27.8%, a difference of 0.24%).
| Demographics | Rating | Rank | Births to Unmarried Women |
| Immigrants | Moldova | 99.7 /100 | #38 | Exceptional 27.3% |
| Immigrants | Malaysia | 99.7 /100 | #39 | Exceptional 27.4% |
| Turks | 99.6 /100 | #40 | Exceptional 27.4% |
| Iraqis | 99.6 /100 | #41 | Exceptional 27.6% |
| Immigrants | Eastern Europe | 99.6 /100 | #42 | Exceptional 27.6% |
| Immigrants | Bulgaria | 99.6 /100 | #43 | Exceptional 27.6% |
| Immigrants | Indonesia | 99.5 /100 | #44 | Exceptional 27.7% |
| Latvians | 99.5 /100 | #45 | Exceptional 27.7% |
| Immigrants | Lithuania | 99.5 /100 | #46 | Exceptional 27.7% |
| Hmong | 99.5 /100 | #47 | Exceptional 27.7% |
| Eastern Europeans | 99.5 /100 | #48 | Exceptional 27.7% |
| Immigrants | Greece | 99.4 /100 | #49 | Exceptional 27.8% |
| Maltese | 99.4 /100 | #50 | Exceptional 27.8% |
| Macedonians | 99.4 /100 | #51 | Exceptional 27.9% |
| Bhutanese | 99.4 /100 | #52 | Exceptional 27.9% |
Demographics Similar to Central American Indians by Births to Unmarried Women
In terms of births to unmarried women, the demographic groups most similar to Central American Indians are Immigrants from Haiti (38.9%, a difference of 0.29%), Yaqui (38.8%, a difference of 0.39%), Immigrants from Jamaica (38.8%, a difference of 0.44%), Honduran (38.7%, a difference of 0.76%), and Immigrants from Honduras (39.3%, a difference of 0.86%).
| Demographics | Rating | Rank | Births to Unmarried Women |
| Spanish Americans | 0.0 /100 | #299 | Tragic 38.6% |
| Immigrants | West Indies | 0.0 /100 | #300 | Tragic 38.6% |
| Haitians | 0.0 /100 | #301 | Tragic 38.6% |
| Hondurans | 0.0 /100 | #302 | Tragic 38.7% |
| Immigrants | Jamaica | 0.0 /100 | #303 | Tragic 38.8% |
| Yaqui | 0.0 /100 | #304 | Tragic 38.8% |
| Immigrants | Haiti | 0.0 /100 | #305 | Tragic 38.9% |
| Central American Indians | 0.0 /100 | #306 | Tragic 39.0% |
| Immigrants | Honduras | 0.0 /100 | #307 | Tragic 39.3% |
| Aleuts | 0.0 /100 | #308 | Tragic 39.3% |
| Cubans | 0.0 /100 | #309 | Tragic 39.4% |
| Immigrants | Dominica | 0.0 /100 | #310 | Tragic 39.5% |
| Immigrants | Azores | 0.0 /100 | #311 | Tragic 39.6% |
| U.S. Virgin Islanders | 0.0 /100 | #312 | Tragic 39.6% |
| Africans | 0.0 /100 | #313 | Tragic 39.7% |