Kenyan vs Immigrants from Chile Divorced or Separated
COMPARE
Kenyan
Immigrants from Chile
Divorced or Separated
Divorced or Separated Comparison
Kenyans
Immigrants from Chile
12.2%
DIVORCED OR SEPARATED
21.8/ 100
METRIC RATING
204th/ 347
METRIC RANK
12.1%
DIVORCED OR SEPARATED
39.0/ 100
METRIC RATING
186th/ 347
METRIC RANK
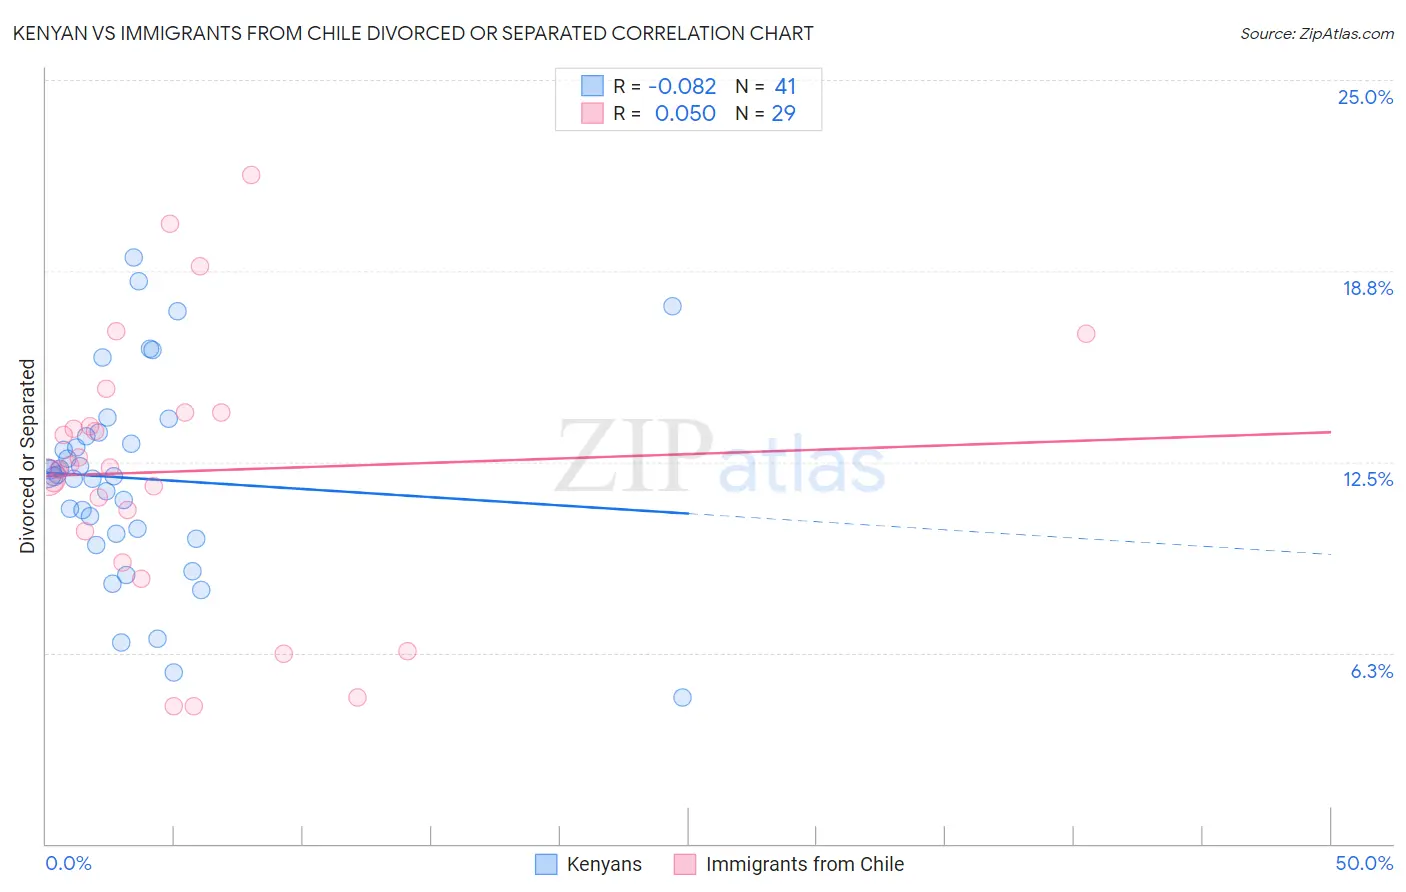
Kenyan vs Immigrants from Chile Divorced or Separated Correlation Chart
The statistical analysis conducted on geographies consisting of 168,184,895 people shows a slight negative correlation between the proportion of Kenyans and percentage of population currently divorced or separated in the United States with a correlation coefficient (R) of -0.082 and weighted average of 12.2%. Similarly, the statistical analysis conducted on geographies consisting of 218,625,132 people shows no correlation between the proportion of Immigrants from Chile and percentage of population currently divorced or separated in the United States with a correlation coefficient (R) of 0.050 and weighted average of 12.1%, a difference of 0.72%.
Divorced or Separated Correlation Summary
| Measurement | Kenyan | Immigrants from Chile |
| Minimum | 4.8% | 4.5% |
| Maximum | 19.2% | 21.9% |
| Range | 14.4% | 17.4% |
| Mean | 11.9% | 12.2% |
| Median | 12.0% | 12.3% |
| Interquartile 25% (IQ1) | 10.1% | 9.7% |
| Interquartile 75% (IQ3) | 13.4% | 14.1% |
| Interquartile Range (IQR) | 3.3% | 4.4% |
| Standard Deviation (Sample) | 3.3% | 4.4% |
| Standard Deviation (Population) | 3.3% | 4.3% |
Demographics Similar to Kenyans and Immigrants from Chile by Divorced or Separated
In terms of divorced or separated, the demographic groups most similar to Kenyans are Immigrants from Costa Rica (12.2%, a difference of 0.030%), Immigrants from Guatemala (12.2%, a difference of 0.070%), Portuguese (12.2%, a difference of 0.080%), Guatemalan (12.2%, a difference of 0.24%), and South American (12.2%, a difference of 0.31%). Similarly, the demographic groups most similar to Immigrants from Chile are Immigrants from Nigeria (12.1%, a difference of 0.050%), Belizean (12.1%, a difference of 0.050%), Immigrants from Belize (12.1%, a difference of 0.050%), Sierra Leonean (12.1%, a difference of 0.13%), and Moroccan (12.1%, a difference of 0.16%).
| Demographics | Rating | Rank | Divorced or Separated |
| Immigrants | Nigeria | 40.5 /100 | #185 | Average 12.1% |
| Immigrants | Chile | 39.0 /100 | #186 | Fair 12.1% |
| Belizeans | 37.7 /100 | #187 | Fair 12.1% |
| Immigrants | Belize | 37.6 /100 | #188 | Fair 12.1% |
| Sierra Leoneans | 35.5 /100 | #189 | Fair 12.1% |
| Moroccans | 34.8 /100 | #190 | Fair 12.1% |
| Swedes | 34.4 /100 | #191 | Fair 12.1% |
| Norwegians | 33.2 /100 | #192 | Fair 12.1% |
| Immigrants | Thailand | 32.5 /100 | #193 | Fair 12.1% |
| Immigrants | Eritrea | 31.9 /100 | #194 | Fair 12.1% |
| Immigrants | England | 31.4 /100 | #195 | Fair 12.1% |
| Immigrants | Burma/Myanmar | 30.4 /100 | #196 | Fair 12.1% |
| Immigrants | Africa | 30.3 /100 | #197 | Fair 12.1% |
| Nigerians | 30.1 /100 | #198 | Fair 12.1% |
| Central Americans | 29.4 /100 | #199 | Fair 12.1% |
| South Americans | 28.6 /100 | #200 | Fair 12.2% |
| Guatemalans | 26.9 /100 | #201 | Fair 12.2% |
| Portuguese | 23.5 /100 | #202 | Fair 12.2% |
| Immigrants | Guatemala | 23.2 /100 | #203 | Fair 12.2% |
| Kenyans | 21.8 /100 | #204 | Fair 12.2% |
| Immigrants | Costa Rica | 21.3 /100 | #205 | Fair 12.2% |