Japanese vs Chippewa Births to Unmarried Women
COMPARE
Japanese
Chippewa
Births to Unmarried Women
Births to Unmarried Women Comparison
Japanese
Chippewa
35.2%
BIRTHS TO UNMARRIED WOMEN
0.9/ 100
METRIC RATING
243rd/ 347
METRIC RANK
42.6%
BIRTHS TO UNMARRIED WOMEN
0.0/ 100
METRIC RATING
330th/ 347
METRIC RANK
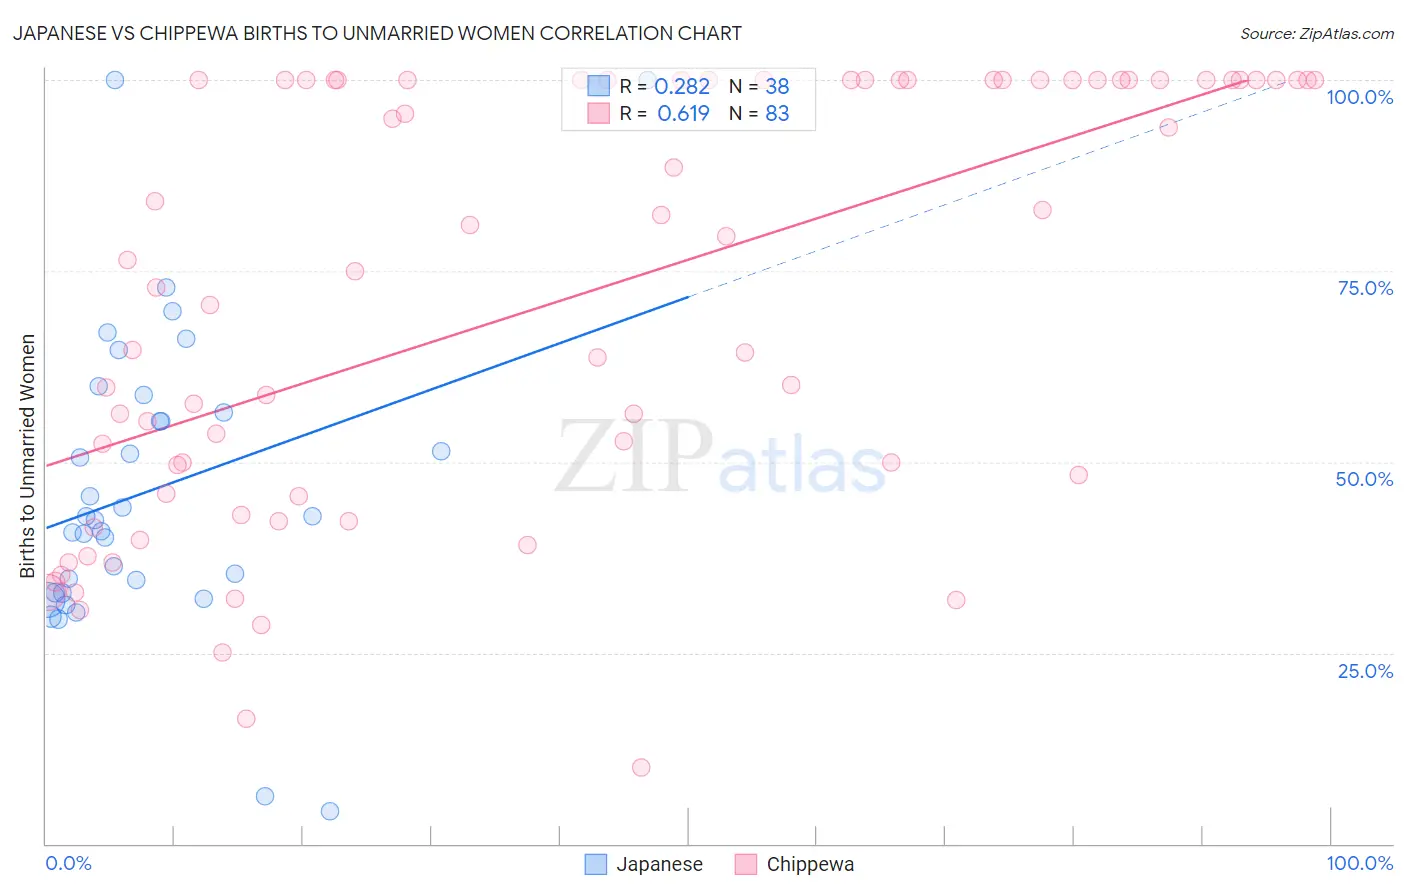
Japanese vs Chippewa Births to Unmarried Women Correlation Chart
The statistical analysis conducted on geographies consisting of 240,312,984 people shows a weak positive correlation between the proportion of Japanese and percentage of births to unmarried women in the United States with a correlation coefficient (R) of 0.282 and weighted average of 35.2%. Similarly, the statistical analysis conducted on geographies consisting of 205,326,129 people shows a significant positive correlation between the proportion of Chippewa and percentage of births to unmarried women in the United States with a correlation coefficient (R) of 0.619 and weighted average of 42.6%, a difference of 21.2%.
Births to Unmarried Women Correlation Summary
| Measurement | Japanese | Chippewa |
| Minimum | 4.3% | 10.0% |
| Maximum | 100.0% | 100.0% |
| Range | 95.7% | 90.0% |
| Mean | 46.3% | 71.0% |
| Median | 42.6% | 75.0% |
| Interquartile 25% (IQ1) | 32.9% | 45.5% |
| Interquartile 75% (IQ3) | 56.4% | 100.0% |
| Interquartile Range (IQR) | 23.5% | 54.5% |
| Standard Deviation (Sample) | 19.9% | 27.9% |
| Standard Deviation (Population) | 19.7% | 27.7% |
Similar Demographics by Births to Unmarried Women
Demographics Similar to Japanese by Births to Unmarried Women
In terms of births to unmarried women, the demographic groups most similar to Japanese are Guyanese (35.2%, a difference of 0.060%), Shoshone (35.3%, a difference of 0.40%), Indonesian (35.0%, a difference of 0.49%), Nigerian (35.3%, a difference of 0.51%), and Immigrants from Guyana (35.0%, a difference of 0.59%).
| Demographics | Rating | Rank | Births to Unmarried Women |
| Immigrants | Cameroon | 1.6 /100 | #236 | Tragic 34.7% |
| Marshallese | 1.6 /100 | #237 | Tragic 34.8% |
| Immigrants | Cambodia | 1.6 /100 | #238 | Tragic 34.8% |
| Sierra Leoneans | 1.4 /100 | #239 | Tragic 34.9% |
| Immigrants | Middle Africa | 1.2 /100 | #240 | Tragic 34.9% |
| Immigrants | Guyana | 1.2 /100 | #241 | Tragic 35.0% |
| Indonesians | 1.2 /100 | #242 | Tragic 35.0% |
| Japanese | 0.9 /100 | #243 | Tragic 35.2% |
| Guyanese | 0.9 /100 | #244 | Tragic 35.2% |
| Shoshone | 0.8 /100 | #245 | Tragic 35.3% |
| Nigerians | 0.7 /100 | #246 | Tragic 35.3% |
| Immigrants | Nigeria | 0.7 /100 | #247 | Tragic 35.4% |
| Immigrants | Nonimmigrants | 0.6 /100 | #248 | Tragic 35.5% |
| Bermudans | 0.6 /100 | #249 | Tragic 35.5% |
| Mexican American Indians | 0.4 /100 | #250 | Tragic 35.7% |
Demographics Similar to Chippewa by Births to Unmarried Women
In terms of births to unmarried women, the demographic groups most similar to Chippewa are Paiute (42.5%, a difference of 0.40%), Native/Alaskan (43.0%, a difference of 0.83%), Immigrants from Cabo Verde (42.2%, a difference of 1.0%), Tsimshian (42.2%, a difference of 1.1%), and Kiowa (43.1%, a difference of 1.2%).
| Demographics | Rating | Rank | Births to Unmarried Women |
| Sioux | 0.0 /100 | #323 | Tragic 41.0% |
| Cape Verdeans | 0.0 /100 | #324 | Tragic 41.3% |
| Cheyenne | 0.0 /100 | #325 | Tragic 41.3% |
| Immigrants | Cuba | 0.0 /100 | #326 | Tragic 41.5% |
| Tsimshian | 0.0 /100 | #327 | Tragic 42.2% |
| Immigrants | Cabo Verde | 0.0 /100 | #328 | Tragic 42.2% |
| Paiute | 0.0 /100 | #329 | Tragic 42.5% |
| Chippewa | 0.0 /100 | #330 | Tragic 42.6% |
| Natives/Alaskans | 0.0 /100 | #331 | Tragic 43.0% |
| Kiowa | 0.0 /100 | #332 | Tragic 43.1% |
| Blacks/African Americans | 0.0 /100 | #333 | Tragic 44.3% |
| Yuman | 0.0 /100 | #334 | Tragic 44.4% |
| Colville | 0.0 /100 | #335 | Tragic 45.3% |
| Puerto Ricans | 0.0 /100 | #336 | Tragic 45.7% |
| Houma | 0.0 /100 | #337 | Tragic 46.6% |