Jamaican vs African Family Households with Children
COMPARE
Jamaican
African
Family Households with Children
Family Households with Children Comparison
Jamaicans
Africans
26.9%
FAMILY HOUSEHOLDS WITH CHILDREN
2.5/ 100
METRIC RATING
246th/ 347
METRIC RANK
27.2%
FAMILY HOUSEHOLDS WITH CHILDREN
13.0/ 100
METRIC RATING
214th/ 347
METRIC RANK
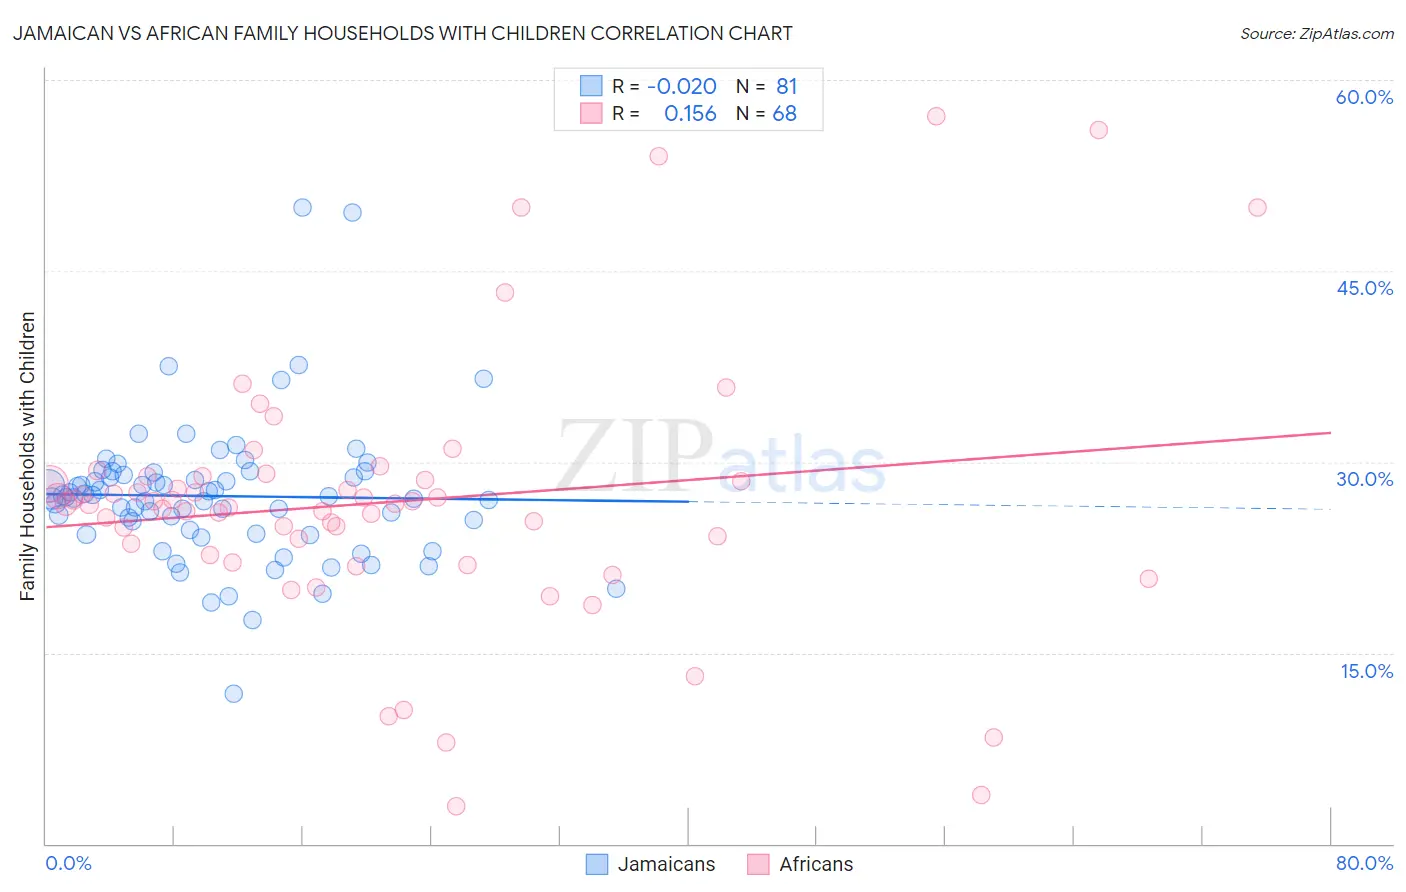
Jamaican vs African Family Households with Children Correlation Chart
The statistical analysis conducted on geographies consisting of 367,528,470 people shows no correlation between the proportion of Jamaicans and percentage of family households with children in the United States with a correlation coefficient (R) of -0.020 and weighted average of 26.9%. Similarly, the statistical analysis conducted on geographies consisting of 469,417,507 people shows a poor positive correlation between the proportion of Africans and percentage of family households with children in the United States with a correlation coefficient (R) of 0.156 and weighted average of 27.2%, a difference of 1.0%.
Family Households with Children Correlation Summary
| Measurement | Jamaican | African |
| Minimum | 11.8% | 3.0% |
| Maximum | 50.0% | 57.1% |
| Range | 38.2% | 54.2% |
| Mean | 27.3% | 26.8% |
| Median | 27.2% | 26.7% |
| Interquartile 25% (IQ1) | 24.5% | 23.1% |
| Interquartile 75% (IQ3) | 29.1% | 28.7% |
| Interquartile Range (IQR) | 4.5% | 5.6% |
| Standard Deviation (Sample) | 5.5% | 10.3% |
| Standard Deviation (Population) | 5.5% | 10.3% |
Similar Demographics by Family Households with Children
Demographics Similar to Jamaicans by Family Households with Children
In terms of family households with children, the demographic groups most similar to Jamaicans are Potawatomi (26.9%, a difference of 0.060%), Australian (26.9%, a difference of 0.070%), Immigrants from Kazakhstan (26.9%, a difference of 0.070%), Ukrainian (26.9%, a difference of 0.090%), and Immigrants from Eastern Europe (26.9%, a difference of 0.090%).
| Demographics | Rating | Rank | Family Households with Children |
| Immigrants | Southern Europe | 3.4 /100 | #239 | Tragic 26.9% |
| Immigrants | Bulgaria | 3.3 /100 | #240 | Tragic 26.9% |
| Navajo | 3.2 /100 | #241 | Tragic 26.9% |
| Immigrants | England | 3.2 /100 | #242 | Tragic 26.9% |
| Immigrants | Saudi Arabia | 2.9 /100 | #243 | Tragic 26.9% |
| Ukrainians | 2.9 /100 | #244 | Tragic 26.9% |
| Australians | 2.8 /100 | #245 | Tragic 26.9% |
| Jamaicans | 2.5 /100 | #246 | Tragic 26.9% |
| Potawatomi | 2.2 /100 | #247 | Tragic 26.9% |
| Immigrants | Kazakhstan | 2.2 /100 | #248 | Tragic 26.9% |
| Immigrants | Eastern Europe | 2.1 /100 | #249 | Tragic 26.9% |
| Belgians | 2.1 /100 | #250 | Tragic 26.9% |
| Immigrants | Bosnia and Herzegovina | 1.9 /100 | #251 | Tragic 26.8% |
| Irish | 1.8 /100 | #252 | Tragic 26.8% |
| Italians | 1.5 /100 | #253 | Tragic 26.8% |
Demographics Similar to Africans by Family Households with Children
In terms of family households with children, the demographic groups most similar to Africans are Northern European (27.2%, a difference of 0.010%), Immigrants from Dominica (27.2%, a difference of 0.040%), Okinawan (27.2%, a difference of 0.040%), Cuban (27.1%, a difference of 0.040%), and U.S. Virgin Islander (27.1%, a difference of 0.040%).
| Demographics | Rating | Rank | Family Households with Children |
| Haitians | 19.8 /100 | #207 | Poor 27.2% |
| Immigrants | Poland | 16.4 /100 | #208 | Poor 27.2% |
| Dutch West Indians | 15.8 /100 | #209 | Poor 27.2% |
| Immigrants | Ukraine | 14.4 /100 | #210 | Poor 27.2% |
| Welsh | 14.2 /100 | #211 | Poor 27.2% |
| Immigrants | Dominica | 13.9 /100 | #212 | Poor 27.2% |
| Okinawans | 13.7 /100 | #213 | Poor 27.2% |
| Africans | 13.0 /100 | #214 | Poor 27.2% |
| Northern Europeans | 12.8 /100 | #215 | Poor 27.2% |
| Cubans | 12.2 /100 | #216 | Poor 27.1% |
| U.S. Virgin Islanders | 12.1 /100 | #217 | Poor 27.1% |
| Greeks | 11.4 /100 | #218 | Poor 27.1% |
| Immigrants | Japan | 10.7 /100 | #219 | Poor 27.1% |
| Austrians | 9.9 /100 | #220 | Tragic 27.1% |
| New Zealanders | 9.6 /100 | #221 | Tragic 27.1% |