Italian vs Immigrants from Moldova Single Father Households
COMPARE
Italian
Immigrants from Moldova
Single Father Households
Single Father Households Comparison
Italians
Immigrants from Moldova
2.2%
SINGLE FATHER HOUSEHOLDS
98.3/ 100
METRIC RATING
110th/ 347
METRIC RANK
2.1%
SINGLE FATHER HOUSEHOLDS
99.1/ 100
METRIC RATING
97th/ 347
METRIC RANK
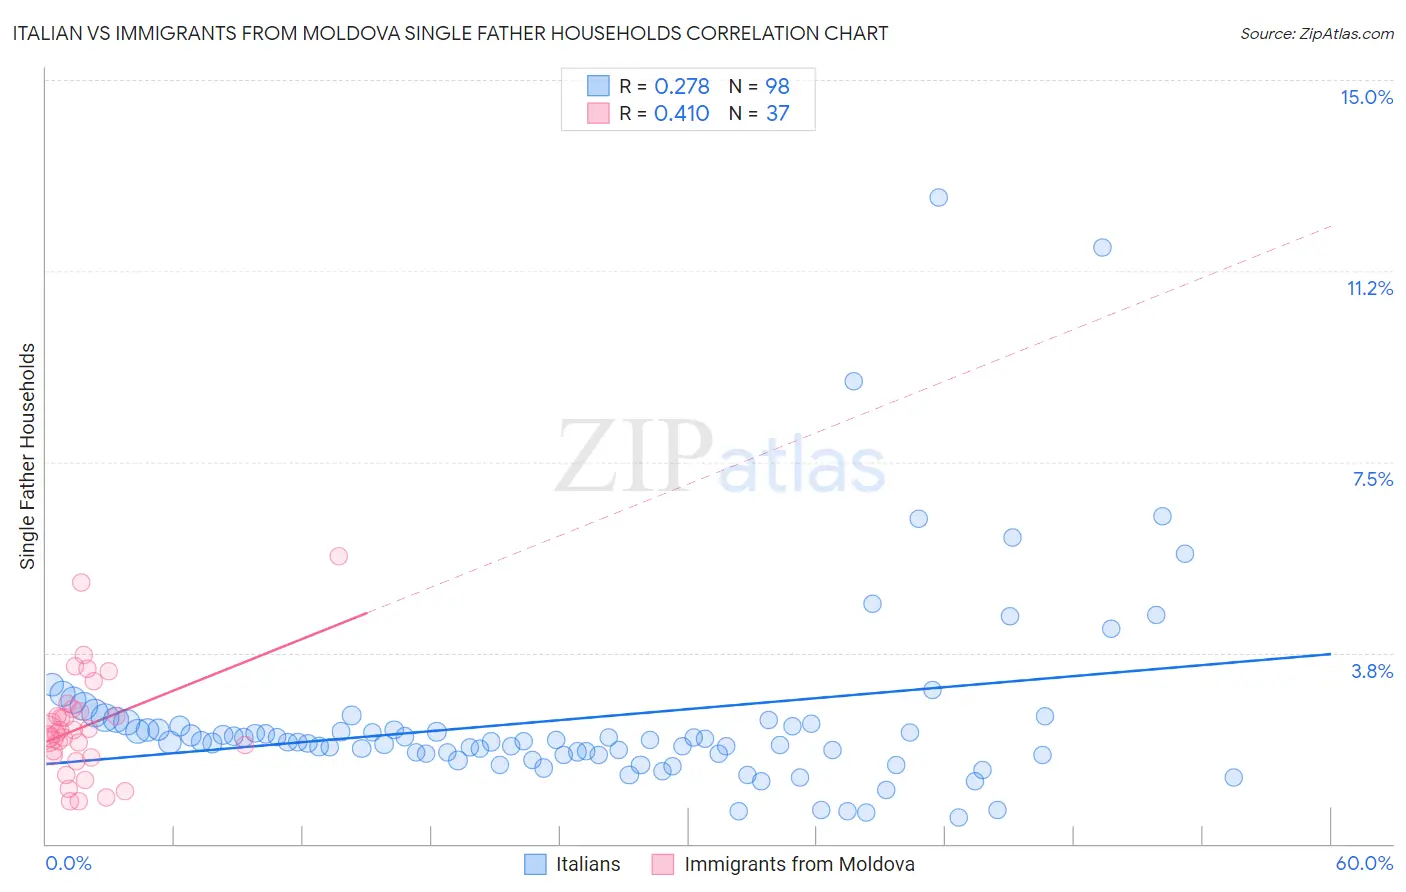
Italian vs Immigrants from Moldova Single Father Households Correlation Chart
The statistical analysis conducted on geographies consisting of 559,287,230 people shows a weak positive correlation between the proportion of Italians and percentage of single father households in the United States with a correlation coefficient (R) of 0.278 and weighted average of 2.2%. Similarly, the statistical analysis conducted on geographies consisting of 124,176,344 people shows a moderate positive correlation between the proportion of Immigrants from Moldova and percentage of single father households in the United States with a correlation coefficient (R) of 0.410 and weighted average of 2.1%, a difference of 1.3%.
Single Father Households Correlation Summary
| Measurement | Italian | Immigrants from Moldova |
| Minimum | 0.51% | 0.82% |
| Maximum | 12.7% | 5.6% |
| Range | 12.2% | 4.8% |
| Mean | 2.5% | 2.3% |
| Median | 2.0% | 2.2% |
| Interquartile 25% (IQ1) | 1.8% | 1.7% |
| Interquartile 75% (IQ3) | 2.3% | 2.6% |
| Interquartile Range (IQR) | 0.56% | 0.92% |
| Standard Deviation (Sample) | 1.9% | 1.0% |
| Standard Deviation (Population) | 1.9% | 1.0% |
Demographics Similar to Italians and Immigrants from Moldova by Single Father Households
In terms of single father households, the demographic groups most similar to Italians are Immigrants from Canada (2.2%, a difference of 0.080%), Immigrants from Trinidad and Tobago (2.2%, a difference of 0.12%), Barbadian (2.2%, a difference of 0.13%), Iraqi (2.2%, a difference of 0.13%), and Immigrants from Netherlands (2.2%, a difference of 0.16%). Similarly, the demographic groups most similar to Immigrants from Moldova are Arab (2.1%, a difference of 0.13%), Guyanese (2.1%, a difference of 0.13%), South African (2.1%, a difference of 0.17%), Bermudan (2.1%, a difference of 0.27%), and Immigrants from Northern Africa (2.1%, a difference of 0.32%).
| Demographics | Rating | Rank | Single Father Households |
| Croatians | 99.3 /100 | #93 | Exceptional 2.1% |
| Ukrainians | 99.3 /100 | #94 | Exceptional 2.1% |
| Bermudans | 99.2 /100 | #95 | Exceptional 2.1% |
| Arabs | 99.2 /100 | #96 | Exceptional 2.1% |
| Immigrants | Moldova | 99.1 /100 | #97 | Exceptional 2.1% |
| Guyanese | 99.1 /100 | #98 | Exceptional 2.1% |
| South Africans | 99.1 /100 | #99 | Exceptional 2.1% |
| Immigrants | Northern Africa | 99.0 /100 | #100 | Exceptional 2.1% |
| Immigrants | Western Europe | 98.9 /100 | #101 | Exceptional 2.1% |
| Argentineans | 98.9 /100 | #102 | Exceptional 2.1% |
| Lebanese | 98.9 /100 | #103 | Exceptional 2.1% |
| Alsatians | 98.9 /100 | #104 | Exceptional 2.1% |
| Palestinians | 98.6 /100 | #105 | Exceptional 2.2% |
| Immigrants | Southern Europe | 98.6 /100 | #106 | Exceptional 2.2% |
| Slovenes | 98.5 /100 | #107 | Exceptional 2.2% |
| Immigrants | Netherlands | 98.5 /100 | #108 | Exceptional 2.2% |
| Barbadians | 98.4 /100 | #109 | Exceptional 2.2% |
| Italians | 98.3 /100 | #110 | Exceptional 2.2% |
| Immigrants | Canada | 98.3 /100 | #111 | Exceptional 2.2% |
| Immigrants | Trinidad and Tobago | 98.2 /100 | #112 | Exceptional 2.2% |
| Iraqis | 98.2 /100 | #113 | Exceptional 2.2% |