Iroquois vs Immigrants from Argentina Family Households with Children
COMPARE
Iroquois
Immigrants from Argentina
Family Households with Children
Family Households with Children Comparison
Iroquois
Immigrants from Argentina
26.1%
FAMILY HOUSEHOLDS WITH CHILDREN
0.0/ 100
METRIC RATING
318th/ 347
METRIC RANK
27.5%
FAMILY HOUSEHOLDS WITH CHILDREN
52.2/ 100
METRIC RATING
173rd/ 347
METRIC RANK
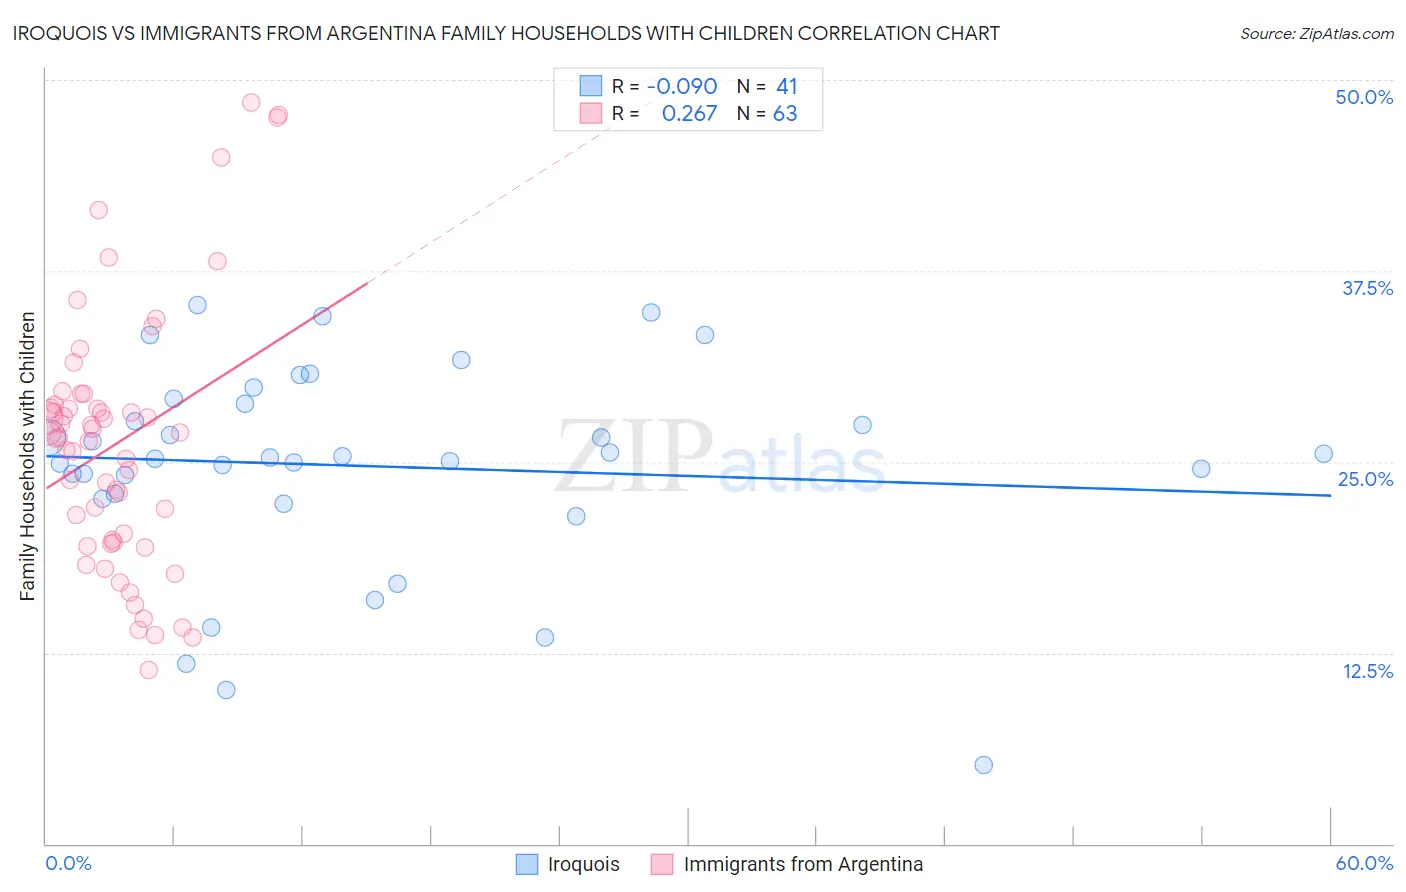
Iroquois vs Immigrants from Argentina Family Households with Children Correlation Chart
The statistical analysis conducted on geographies consisting of 207,224,284 people shows a slight negative correlation between the proportion of Iroquois and percentage of family households with children in the United States with a correlation coefficient (R) of -0.090 and weighted average of 26.1%. Similarly, the statistical analysis conducted on geographies consisting of 264,229,087 people shows a weak positive correlation between the proportion of Immigrants from Argentina and percentage of family households with children in the United States with a correlation coefficient (R) of 0.267 and weighted average of 27.5%, a difference of 5.4%.
Family Households with Children Correlation Summary
| Measurement | Iroquois | Immigrants from Argentina |
| Minimum | 5.2% | 11.4% |
| Maximum | 35.2% | 48.6% |
| Range | 30.1% | 37.2% |
| Mean | 24.7% | 26.2% |
| Median | 25.3% | 26.6% |
| Interquartile 25% (IQ1) | 22.7% | 19.7% |
| Interquartile 75% (IQ3) | 29.0% | 28.7% |
| Interquartile Range (IQR) | 6.2% | 9.0% |
| Standard Deviation (Sample) | 6.8% | 8.5% |
| Standard Deviation (Population) | 6.7% | 8.4% |
Similar Demographics by Family Households with Children
Demographics Similar to Iroquois by Family Households with Children
In terms of family households with children, the demographic groups most similar to Iroquois are Ottawa (26.1%, a difference of 0.050%), Immigrants from France (26.0%, a difference of 0.090%), Tlingit-Haida (26.0%, a difference of 0.10%), British West Indian (26.0%, a difference of 0.12%), and Estonian (26.1%, a difference of 0.13%).
| Demographics | Rating | Rank | Family Households with Children |
| Colville | 0.0 /100 | #311 | Tragic 26.2% |
| Immigrants | Czechoslovakia | 0.0 /100 | #312 | Tragic 26.2% |
| Cree | 0.0 /100 | #313 | Tragic 26.2% |
| French Canadians | 0.0 /100 | #314 | Tragic 26.1% |
| Immigrants | Norway | 0.0 /100 | #315 | Tragic 26.1% |
| Estonians | 0.0 /100 | #316 | Tragic 26.1% |
| Ottawa | 0.0 /100 | #317 | Tragic 26.1% |
| Iroquois | 0.0 /100 | #318 | Tragic 26.1% |
| Immigrants | France | 0.0 /100 | #319 | Tragic 26.0% |
| Tlingit-Haida | 0.0 /100 | #320 | Tragic 26.0% |
| British West Indians | 0.0 /100 | #321 | Tragic 26.0% |
| Immigrants | Greece | 0.0 /100 | #322 | Tragic 26.0% |
| Immigrants | Australia | 0.0 /100 | #323 | Tragic 26.0% |
| Chinese | 0.0 /100 | #324 | Tragic 26.0% |
| Barbadians | 0.0 /100 | #325 | Tragic 26.0% |
Demographics Similar to Immigrants from Argentina by Family Households with Children
In terms of family households with children, the demographic groups most similar to Immigrants from Argentina are Israeli (27.5%, a difference of 0.040%), Blackfeet (27.5%, a difference of 0.050%), White/Caucasian (27.4%, a difference of 0.050%), British (27.4%, a difference of 0.050%), and Immigrants from China (27.4%, a difference of 0.060%).
| Demographics | Rating | Rank | Family Households with Children |
| Immigrants | Nonimmigrants | 61.2 /100 | #166 | Good 27.5% |
| Dominicans | 61.1 /100 | #167 | Good 27.5% |
| Immigrants | Kuwait | 60.9 /100 | #168 | Good 27.5% |
| Seminole | 56.9 /100 | #169 | Average 27.5% |
| Cherokee | 56.7 /100 | #170 | Average 27.5% |
| Blackfeet | 54.3 /100 | #171 | Average 27.5% |
| Israelis | 53.9 /100 | #172 | Average 27.5% |
| Immigrants | Argentina | 52.2 /100 | #173 | Average 27.5% |
| Whites/Caucasians | 50.0 /100 | #174 | Average 27.4% |
| British | 49.9 /100 | #175 | Average 27.4% |
| Immigrants | China | 49.6 /100 | #176 | Average 27.4% |
| Ugandans | 49.2 /100 | #177 | Average 27.4% |
| Spanish Americans | 48.9 /100 | #178 | Average 27.4% |
| Turks | 46.9 /100 | #179 | Average 27.4% |
| Immigrants | Turkey | 46.9 /100 | #180 | Average 27.4% |