Irish vs Bangladeshi Single Mother Households
COMPARE
Irish
Bangladeshi
Single Mother Households
Single Mother Households Comparison
Irish
Bangladeshis
5.8%
SINGLE MOTHER HOUSEHOLDS
94.8/ 100
METRIC RATING
115th/ 347
METRIC RANK
8.1%
SINGLE MOTHER HOUSEHOLDS
0.0/ 100
METRIC RATING
312th/ 347
METRIC RANK
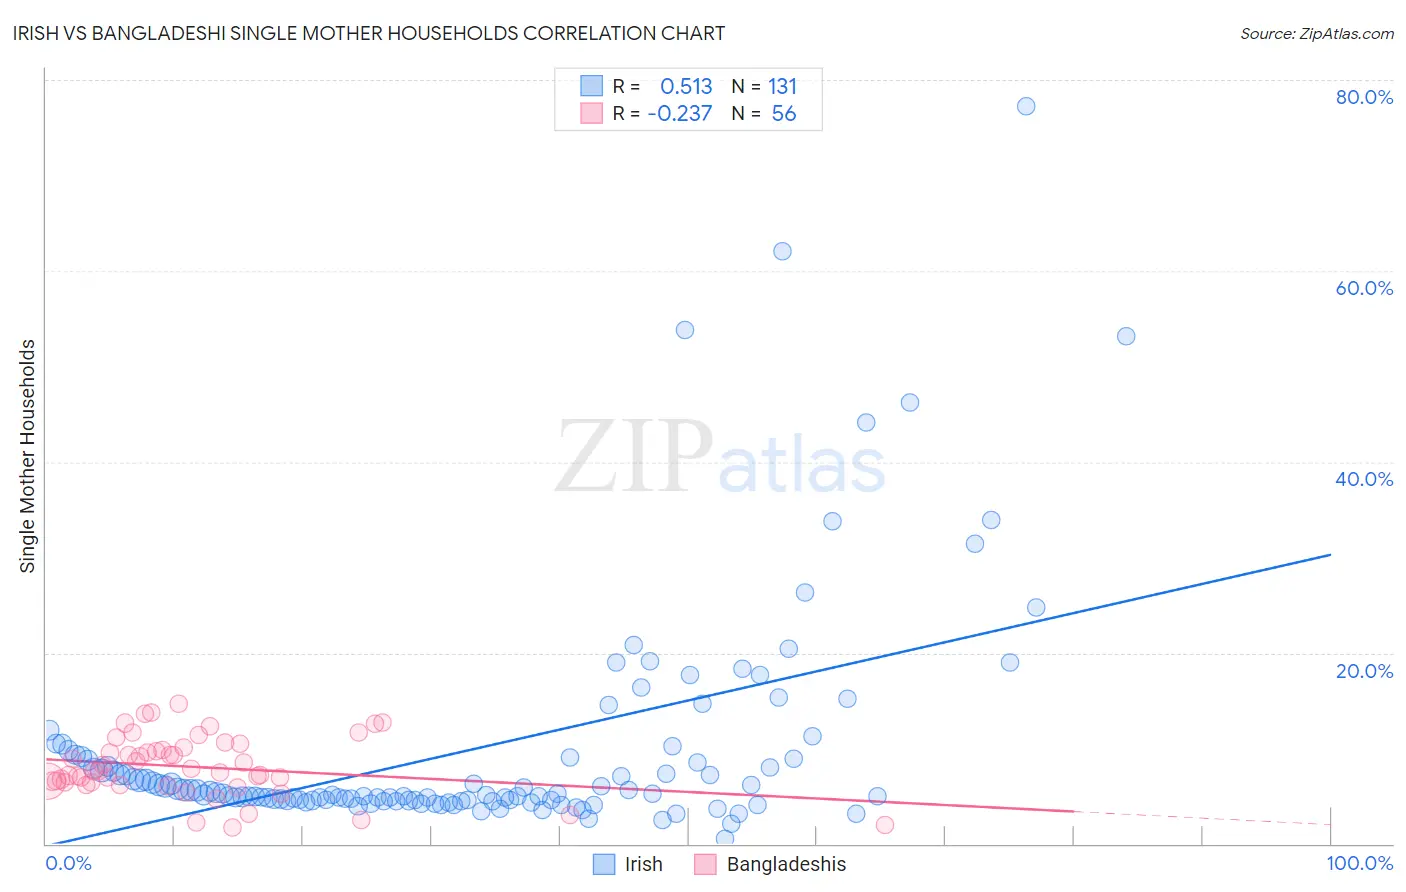
Irish vs Bangladeshi Single Mother Households Correlation Chart
The statistical analysis conducted on geographies consisting of 573,559,537 people shows a substantial positive correlation between the proportion of Irish and percentage of single mother households in the United States with a correlation coefficient (R) of 0.513 and weighted average of 5.8%. Similarly, the statistical analysis conducted on geographies consisting of 141,271,331 people shows a weak negative correlation between the proportion of Bangladeshis and percentage of single mother households in the United States with a correlation coefficient (R) of -0.237 and weighted average of 8.1%, a difference of 40.1%.
Single Mother Households Correlation Summary
| Measurement | Irish | Bangladeshi |
| Minimum | 0.49% | 1.7% |
| Maximum | 77.3% | 14.6% |
| Range | 76.8% | 13.0% |
| Mean | 10.0% | 8.1% |
| Median | 5.2% | 7.6% |
| Interquartile 25% (IQ1) | 4.5% | 6.4% |
| Interquartile 75% (IQ3) | 9.0% | 9.9% |
| Interquartile Range (IQR) | 4.5% | 3.5% |
| Standard Deviation (Sample) | 12.1% | 3.1% |
| Standard Deviation (Population) | 12.0% | 3.1% |
Similar Demographics by Single Mother Households
Demographics Similar to Irish by Single Mother Households
In terms of single mother households, the demographic groups most similar to Irish are Pennsylvania German (5.8%, a difference of 0.070%), Bolivian (5.8%, a difference of 0.14%), Dutch (5.8%, a difference of 0.19%), Mongolian (5.8%, a difference of 0.31%), and Laotian (5.8%, a difference of 0.32%).
| Demographics | Rating | Rank | Single Mother Households |
| Immigrants | Italy | 95.8 /100 | #108 | Exceptional 5.8% |
| Immigrants | Western Europe | 95.7 /100 | #109 | Exceptional 5.8% |
| British | 95.5 /100 | #110 | Exceptional 5.8% |
| Immigrants | England | 95.5 /100 | #111 | Exceptional 5.8% |
| Immigrants | Kuwait | 95.4 /100 | #112 | Exceptional 5.8% |
| Mongolians | 95.3 /100 | #113 | Exceptional 5.8% |
| Dutch | 95.1 /100 | #114 | Exceptional 5.8% |
| Irish | 94.8 /100 | #115 | Exceptional 5.8% |
| Pennsylvania Germans | 94.7 /100 | #116 | Exceptional 5.8% |
| Bolivians | 94.6 /100 | #117 | Exceptional 5.8% |
| Laotians | 94.3 /100 | #118 | Exceptional 5.8% |
| South Africans | 94.1 /100 | #119 | Exceptional 5.8% |
| Tongans | 93.7 /100 | #120 | Exceptional 5.8% |
| Argentineans | 93.7 /100 | #121 | Exceptional 5.8% |
| Belgians | 93.5 /100 | #122 | Exceptional 5.8% |
Demographics Similar to Bangladeshis by Single Mother Households
In terms of single mother households, the demographic groups most similar to Bangladeshis are Immigrants from Grenada (8.2%, a difference of 0.16%), Immigrants from Mexico (8.2%, a difference of 0.28%), Immigrants from Congo (8.1%, a difference of 0.29%), Immigrants from Western Africa (8.2%, a difference of 0.31%), and African (8.2%, a difference of 0.46%).
| Demographics | Rating | Rank | Single Mother Households |
| Colville | 0.0 /100 | #305 | Tragic 8.0% |
| Immigrants | Barbados | 0.0 /100 | #306 | Tragic 8.0% |
| Immigrants | St. Vincent and the Grenadines | 0.0 /100 | #307 | Tragic 8.0% |
| Immigrants | Central America | 0.0 /100 | #308 | Tragic 8.1% |
| Cheyenne | 0.0 /100 | #309 | Tragic 8.1% |
| Hondurans | 0.0 /100 | #310 | Tragic 8.1% |
| Immigrants | Congo | 0.0 /100 | #311 | Tragic 8.1% |
| Bangladeshis | 0.0 /100 | #312 | Tragic 8.1% |
| Immigrants | Grenada | 0.0 /100 | #313 | Tragic 8.2% |
| Immigrants | Mexico | 0.0 /100 | #314 | Tragic 8.2% |
| Immigrants | Western Africa | 0.0 /100 | #315 | Tragic 8.2% |
| Africans | 0.0 /100 | #316 | Tragic 8.2% |
| Immigrants | Honduras | 0.0 /100 | #317 | Tragic 8.2% |
| Senegalese | 0.0 /100 | #318 | Tragic 8.2% |
| Jamaicans | 0.0 /100 | #319 | Tragic 8.2% |