Irish vs Albanian Births to Unmarried Women
COMPARE
Irish
Albanian
Births to Unmarried Women
Births to Unmarried Women Comparison
Irish
Albanians
32.2%
BIRTHS TO UNMARRIED WOMEN
32.4/ 100
METRIC RATING
191st/ 347
METRIC RANK
28.5%
BIRTHS TO UNMARRIED WOMEN
98.5/ 100
METRIC RATING
73rd/ 347
METRIC RANK
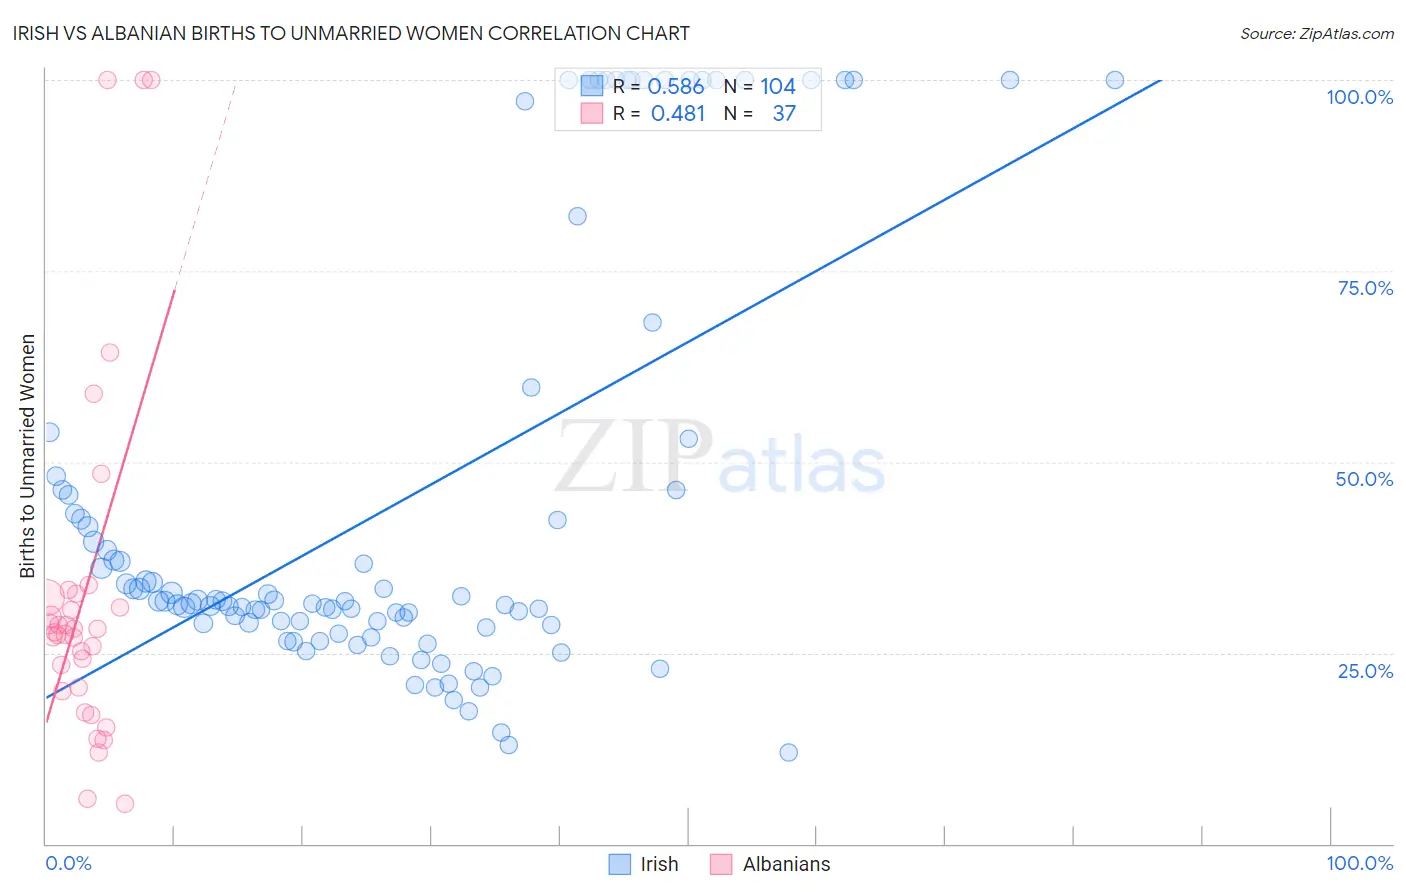
Irish vs Albanian Births to Unmarried Women Correlation Chart
The statistical analysis conducted on geographies consisting of 510,434,207 people shows a substantial positive correlation between the proportion of Irish and percentage of births to unmarried women in the United States with a correlation coefficient (R) of 0.586 and weighted average of 32.2%. Similarly, the statistical analysis conducted on geographies consisting of 182,909,720 people shows a moderate positive correlation between the proportion of Albanians and percentage of births to unmarried women in the United States with a correlation coefficient (R) of 0.481 and weighted average of 28.5%, a difference of 12.9%.
Births to Unmarried Women Correlation Summary
| Measurement | Irish | Albanian |
| Minimum | 11.9% | 5.2% |
| Maximum | 100.0% | 100.0% |
| Range | 88.1% | 94.8% |
| Mean | 44.6% | 32.8% |
| Median | 31.8% | 27.7% |
| Interquartile 25% (IQ1) | 28.8% | 20.2% |
| Interquartile 75% (IQ3) | 46.3% | 32.5% |
| Interquartile Range (IQR) | 17.6% | 12.3% |
| Standard Deviation (Sample) | 28.0% | 23.4% |
| Standard Deviation (Population) | 27.9% | 23.1% |
Similar Demographics by Births to Unmarried Women
Demographics Similar to Irish by Births to Unmarried Women
In terms of births to unmarried women, the demographic groups most similar to Irish are Tlingit-Haida (32.2%, a difference of 0.020%), Colombian (32.2%, a difference of 0.050%), Fijian (32.3%, a difference of 0.14%), Immigrants from Kenya (32.1%, a difference of 0.46%), and Osage (32.1%, a difference of 0.49%).
| Demographics | Rating | Rank | Births to Unmarried Women |
| Immigrants | South America | 40.7 /100 | #184 | Average 32.0% |
| Germans | 39.5 /100 | #185 | Fair 32.0% |
| Welsh | 38.2 /100 | #186 | Fair 32.0% |
| Czechoslovakians | 38.0 /100 | #187 | Fair 32.0% |
| Osage | 37.1 /100 | #188 | Fair 32.1% |
| Immigrants | Kenya | 36.9 /100 | #189 | Fair 32.1% |
| Tlingit-Haida | 32.6 /100 | #190 | Fair 32.2% |
| Irish | 32.4 /100 | #191 | Fair 32.2% |
| Colombians | 31.9 /100 | #192 | Fair 32.2% |
| Fijians | 31.1 /100 | #193 | Fair 32.3% |
| Sudanese | 27.3 /100 | #194 | Fair 32.4% |
| Samoans | 21.9 /100 | #195 | Fair 32.6% |
| Immigrants | Colombia | 21.7 /100 | #196 | Fair 32.6% |
| Immigrants | Immigrants | 20.6 /100 | #197 | Fair 32.7% |
| Costa Ricans | 20.3 /100 | #198 | Fair 32.7% |
Demographics Similar to Albanians by Births to Unmarried Women
In terms of births to unmarried women, the demographic groups most similar to Albanians are Immigrants from Bolivia (28.6%, a difference of 0.020%), Immigrants from Sweden (28.5%, a difference of 0.050%), Jordanian (28.5%, a difference of 0.11%), Immigrants from Switzerland (28.6%, a difference of 0.11%), and Israeli (28.6%, a difference of 0.13%).
| Demographics | Rating | Rank | Births to Unmarried Women |
| Immigrants | Egypt | 98.8 /100 | #66 | Exceptional 28.4% |
| Palestinians | 98.7 /100 | #67 | Exceptional 28.4% |
| Immigrants | Europe | 98.7 /100 | #68 | Exceptional 28.4% |
| Bolivians | 98.7 /100 | #69 | Exceptional 28.5% |
| Laotians | 98.6 /100 | #70 | Exceptional 28.5% |
| Jordanians | 98.5 /100 | #71 | Exceptional 28.5% |
| Immigrants | Sweden | 98.5 /100 | #72 | Exceptional 28.5% |
| Albanians | 98.5 /100 | #73 | Exceptional 28.5% |
| Immigrants | Bolivia | 98.5 /100 | #74 | Exceptional 28.6% |
| Immigrants | Switzerland | 98.4 /100 | #75 | Exceptional 28.6% |
| Israelis | 98.4 /100 | #76 | Exceptional 28.6% |
| Immigrants | Northern Europe | 98.3 /100 | #77 | Exceptional 28.6% |
| Zimbabweans | 98.2 /100 | #78 | Exceptional 28.7% |
| Danes | 98.2 /100 | #79 | Exceptional 28.7% |
| Immigrants | Afghanistan | 98.1 /100 | #80 | Exceptional 28.7% |