Inupiat vs Immigrants from Colombia Family Households with Children
COMPARE
Inupiat
Immigrants from Colombia
Family Households with Children
Family Households with Children Comparison
Inupiat
Immigrants from Colombia
32.8%
FAMILY HOUSEHOLDS WITH CHILDREN
100/ 100
METRIC RATING
2nd/ 347
METRIC RANK
28.2%
FAMILY HOUSEHOLDS WITH CHILDREN
99.2/ 100
METRIC RATING
94th/ 347
METRIC RANK
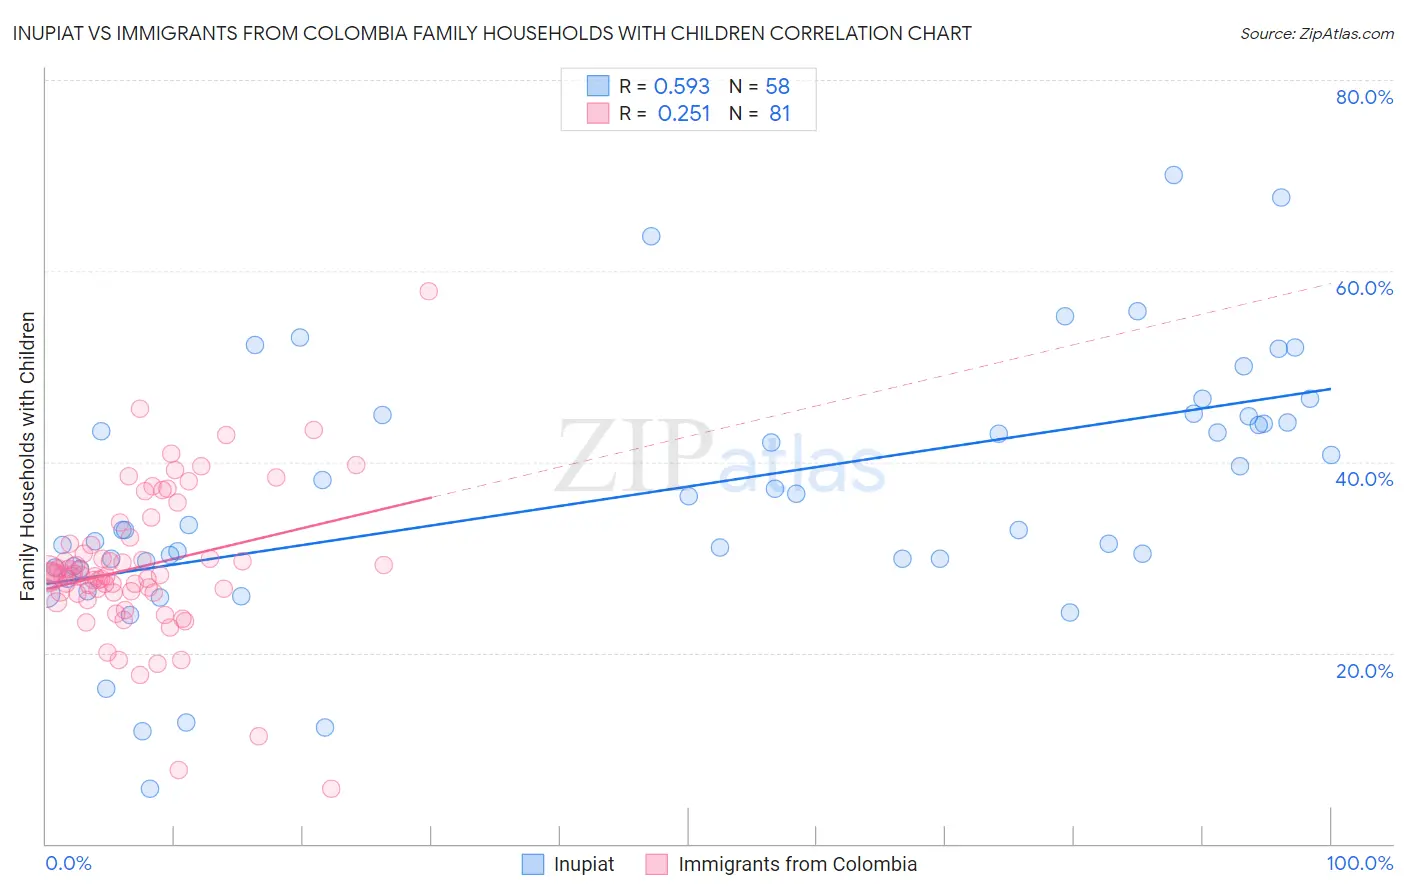
Inupiat vs Immigrants from Colombia Family Households with Children Correlation Chart
The statistical analysis conducted on geographies consisting of 96,318,609 people shows a substantial positive correlation between the proportion of Inupiat and percentage of family households with children in the United States with a correlation coefficient (R) of 0.593 and weighted average of 32.8%. Similarly, the statistical analysis conducted on geographies consisting of 378,425,142 people shows a weak positive correlation between the proportion of Immigrants from Colombia and percentage of family households with children in the United States with a correlation coefficient (R) of 0.251 and weighted average of 28.2%, a difference of 16.5%.
Family Households with Children Correlation Summary
| Measurement | Inupiat | Immigrants from Colombia |
| Minimum | 5.8% | 5.7% |
| Maximum | 70.0% | 57.9% |
| Range | 64.2% | 52.2% |
| Mean | 36.6% | 29.0% |
| Median | 33.1% | 28.1% |
| Interquartile 25% (IQ1) | 29.1% | 26.3% |
| Interquartile 75% (IQ3) | 44.8% | 31.4% |
| Interquartile Range (IQR) | 15.7% | 5.1% |
| Standard Deviation (Sample) | 13.3% | 7.7% |
| Standard Deviation (Population) | 13.2% | 7.7% |
Similar Demographics by Family Households with Children
Demographics Similar to Inupiat by Family Households with Children
In terms of family households with children, the demographic groups most similar to Inupiat are Immigrants from Mexico (31.6%, a difference of 3.9%), Mexican (31.4%, a difference of 4.7%), Tongan (31.2%, a difference of 5.1%), Immigrants from India (31.0%, a difference of 5.8%), and Immigrants from Central America (31.0%, a difference of 6.1%).
| Demographics | Rating | Rank | Family Households with Children |
| Yup'ik | 100 /100 | #1 | Exceptional 37.0% |
| Inupiat | 100 /100 | #2 | Exceptional 32.8% |
| Immigrants | Mexico | 100.0 /100 | #3 | Exceptional 31.6% |
| Mexicans | 100.0 /100 | #4 | Exceptional 31.4% |
| Tongans | 100.0 /100 | #5 | Exceptional 31.2% |
| Immigrants | India | 100.0 /100 | #6 | Exceptional 31.0% |
| Immigrants | Central America | 100.0 /100 | #7 | Exceptional 31.0% |
| Yakama | 100.0 /100 | #8 | Exceptional 30.8% |
| Thais | 100.0 /100 | #9 | Exceptional 30.6% |
| Immigrants | Fiji | 100.0 /100 | #10 | Exceptional 30.5% |
| Nepalese | 100.0 /100 | #11 | Exceptional 30.5% |
| Immigrants | Pakistan | 100.0 /100 | #12 | Exceptional 30.2% |
| Afghans | 100.0 /100 | #13 | Exceptional 30.2% |
| Bangladeshis | 100.0 /100 | #14 | Exceptional 30.1% |
| Immigrants | South Central Asia | 100.0 /100 | #15 | Exceptional 30.0% |
Demographics Similar to Immigrants from Colombia by Family Households with Children
In terms of family households with children, the demographic groups most similar to Immigrants from Colombia are Panamanian (28.2%, a difference of 0.050%), Immigrants from Nicaragua (28.2%, a difference of 0.070%), Ute (28.2%, a difference of 0.090%), Chickasaw (28.2%, a difference of 0.15%), and Chilean (28.1%, a difference of 0.15%).
| Demographics | Rating | Rank | Family Households with Children |
| Colombians | 99.6 /100 | #87 | Exceptional 28.3% |
| Liberians | 99.6 /100 | #88 | Exceptional 28.3% |
| Immigrants | Costa Rica | 99.6 /100 | #89 | Exceptional 28.3% |
| Immigrants | Thailand | 99.5 /100 | #90 | Exceptional 28.2% |
| Immigrants | Liberia | 99.4 /100 | #91 | Exceptional 28.2% |
| Chickasaw | 99.4 /100 | #92 | Exceptional 28.2% |
| Panamanians | 99.3 /100 | #93 | Exceptional 28.2% |
| Immigrants | Colombia | 99.2 /100 | #94 | Exceptional 28.2% |
| Immigrants | Nicaragua | 99.1 /100 | #95 | Exceptional 28.2% |
| Ute | 99.1 /100 | #96 | Exceptional 28.2% |
| Chileans | 98.9 /100 | #97 | Exceptional 28.1% |
| Immigrants | Kenya | 98.9 /100 | #98 | Exceptional 28.1% |
| Immigrants | Azores | 98.8 /100 | #99 | Exceptional 28.1% |
| Indonesians | 98.8 /100 | #100 | Exceptional 28.1% |
| Immigrants | Oceania | 98.8 /100 | #101 | Exceptional 28.1% |