Indonesian vs Immigrants from Jamaica Single Father Households
COMPARE
Indonesian
Immigrants from Jamaica
Single Father Households
Single Father Households Comparison
Indonesians
Immigrants from Jamaica
2.6%
SINGLE FATHER HOUSEHOLDS
0.5/ 100
METRIC RATING
264th/ 347
METRIC RANK
2.3%
SINGLE FATHER HOUSEHOLDS
49.1/ 100
METRIC RATING
175th/ 347
METRIC RANK
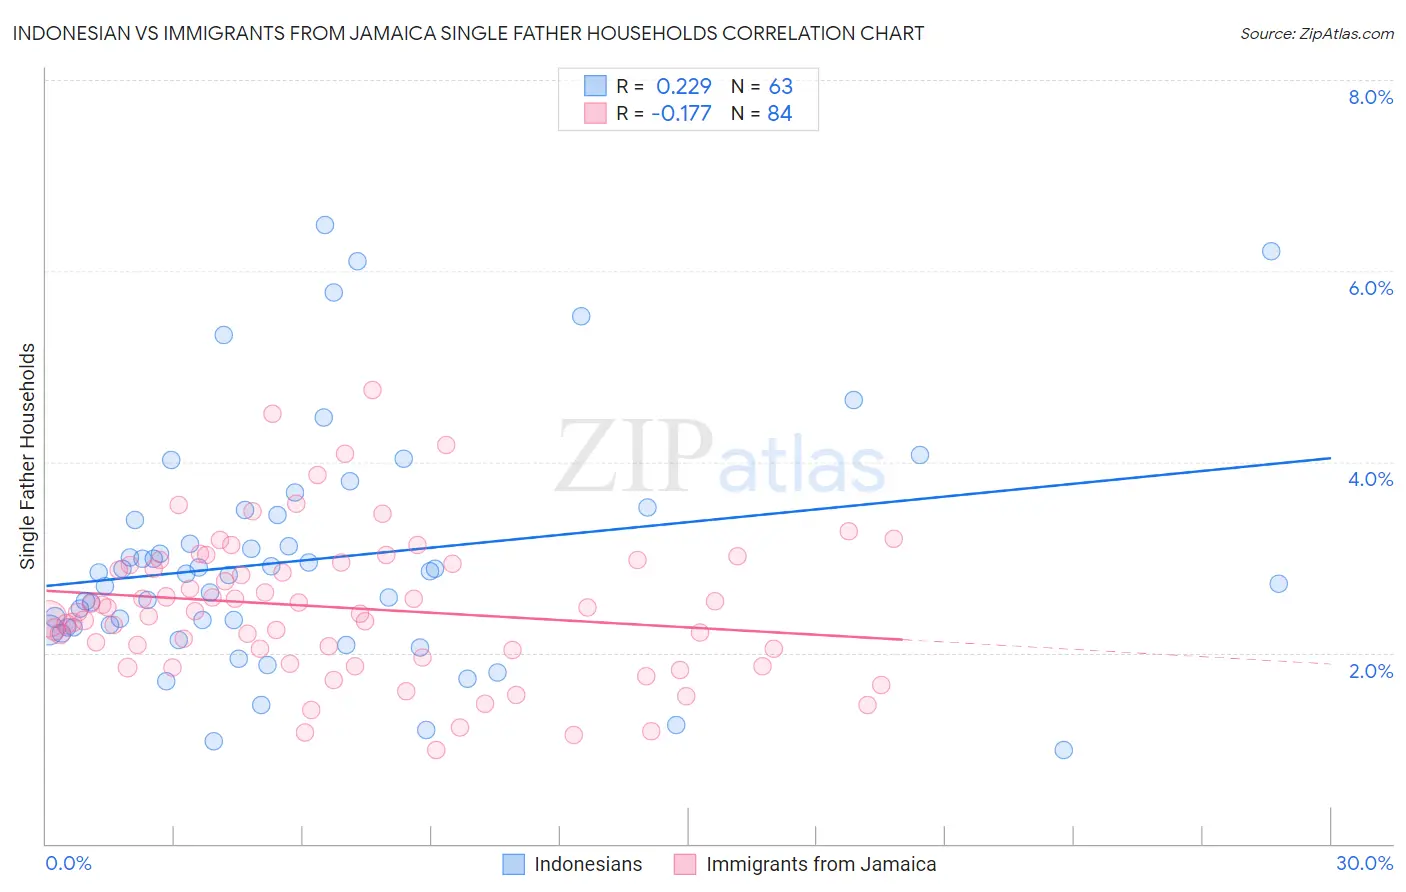
Indonesian vs Immigrants from Jamaica Single Father Households Correlation Chart
The statistical analysis conducted on geographies consisting of 162,222,781 people shows a weak positive correlation between the proportion of Indonesians and percentage of single father households in the United States with a correlation coefficient (R) of 0.229 and weighted average of 2.6%. Similarly, the statistical analysis conducted on geographies consisting of 299,809,060 people shows a poor negative correlation between the proportion of Immigrants from Jamaica and percentage of single father households in the United States with a correlation coefficient (R) of -0.177 and weighted average of 2.3%, a difference of 9.6%.
Single Father Households Correlation Summary
| Measurement | Indonesian | Immigrants from Jamaica |
| Minimum | 0.98% | 0.98% |
| Maximum | 6.5% | 4.7% |
| Range | 5.5% | 3.8% |
| Mean | 3.0% | 2.5% |
| Median | 2.8% | 2.4% |
| Interquartile 25% (IQ1) | 2.3% | 2.0% |
| Interquartile 75% (IQ3) | 3.4% | 2.9% |
| Interquartile Range (IQR) | 1.2% | 0.94% |
| Standard Deviation (Sample) | 1.2% | 0.76% |
| Standard Deviation (Population) | 1.2% | 0.75% |
Similar Demographics by Single Father Households
Demographics Similar to Indonesians by Single Father Households
In terms of single father households, the demographic groups most similar to Indonesians are Immigrants from Micronesia (2.6%, a difference of 0.060%), French American Indian (2.6%, a difference of 0.10%), Guamanian/Chamorro (2.6%, a difference of 0.57%), Haitian (2.6%, a difference of 0.61%), and Dominican (2.5%, a difference of 0.69%).
| Demographics | Rating | Rank | Single Father Households |
| Immigrants | Congo | 1.2 /100 | #257 | Tragic 2.5% |
| Spanish | 1.1 /100 | #258 | Tragic 2.5% |
| Comanche | 1.0 /100 | #259 | Tragic 2.5% |
| Immigrants | Caribbean | 1.0 /100 | #260 | Tragic 2.5% |
| Immigrants | Belize | 0.9 /100 | #261 | Tragic 2.5% |
| Immigrants | Liberia | 0.8 /100 | #262 | Tragic 2.5% |
| Dominicans | 0.8 /100 | #263 | Tragic 2.5% |
| Indonesians | 0.5 /100 | #264 | Tragic 2.6% |
| Immigrants | Micronesia | 0.5 /100 | #265 | Tragic 2.6% |
| French American Indians | 0.5 /100 | #266 | Tragic 2.6% |
| Guamanians/Chamorros | 0.4 /100 | #267 | Tragic 2.6% |
| Haitians | 0.4 /100 | #268 | Tragic 2.6% |
| Cubans | 0.3 /100 | #269 | Tragic 2.6% |
| Seminole | 0.3 /100 | #270 | Tragic 2.6% |
| Creek | 0.2 /100 | #271 | Tragic 2.6% |
Demographics Similar to Immigrants from Jamaica by Single Father Households
In terms of single father households, the demographic groups most similar to Immigrants from Jamaica are Danish (2.3%, a difference of 0.060%), Afghan (2.3%, a difference of 0.070%), Colombian (2.3%, a difference of 0.080%), Costa Rican (2.3%, a difference of 0.37%), and Welsh (2.3%, a difference of 0.37%).
| Demographics | Rating | Rank | Single Father Households |
| Icelanders | 63.1 /100 | #168 | Good 2.3% |
| Czechs | 62.5 /100 | #169 | Good 2.3% |
| Ugandans | 62.2 /100 | #170 | Good 2.3% |
| Swedes | 61.6 /100 | #171 | Good 2.3% |
| Czechoslovakians | 58.9 /100 | #172 | Average 2.3% |
| Celtics | 55.4 /100 | #173 | Average 2.3% |
| Afghans | 50.0 /100 | #174 | Average 2.3% |
| Immigrants | Jamaica | 49.1 /100 | #175 | Average 2.3% |
| Danes | 48.2 /100 | #176 | Average 2.3% |
| Colombians | 48.0 /100 | #177 | Average 2.3% |
| Costa Ricans | 44.1 /100 | #178 | Average 2.3% |
| Welsh | 44.0 /100 | #179 | Average 2.3% |
| Yugoslavians | 43.9 /100 | #180 | Average 2.3% |
| Jamaicans | 43.5 /100 | #181 | Average 2.3% |
| Belgians | 43.3 /100 | #182 | Average 2.3% |