Indian (Asian) vs Immigrants from Lebanon Family Households
COMPARE
Indian (Asian)
Immigrants from Lebanon
Family Households
Family Households Comparison
Indians (Asian)
Immigrants from Lebanon
65.1%
FAMILY HOUSEHOLDS
97.9/ 100
METRIC RATING
103rd/ 347
METRIC RANK
65.5%
FAMILY HOUSEHOLDS
99.7/ 100
METRIC RATING
82nd/ 347
METRIC RANK
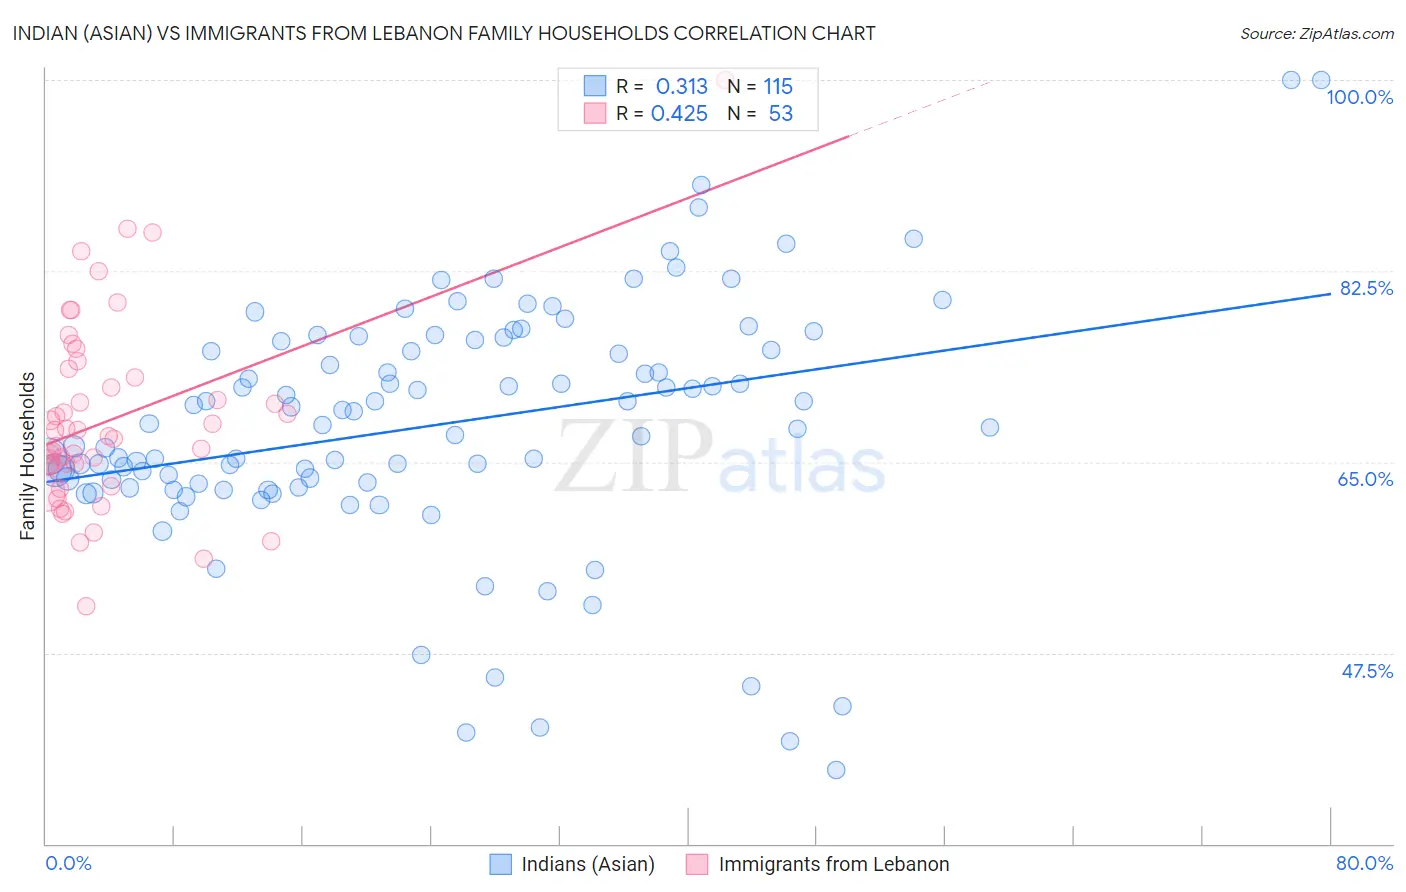
Indian (Asian) vs Immigrants from Lebanon Family Households Correlation Chart
The statistical analysis conducted on geographies consisting of 494,783,710 people shows a mild positive correlation between the proportion of Indians (Asian) and percentage of family households in the United States with a correlation coefficient (R) of 0.313 and weighted average of 65.1%. Similarly, the statistical analysis conducted on geographies consisting of 217,130,535 people shows a moderate positive correlation between the proportion of Immigrants from Lebanon and percentage of family households in the United States with a correlation coefficient (R) of 0.425 and weighted average of 65.5%, a difference of 0.61%.
Family Households Correlation Summary
| Measurement | Indian (Asian) | Immigrants from Lebanon |
| Minimum | 36.8% | 51.8% |
| Maximum | 100.0% | 100.0% |
| Range | 63.2% | 48.2% |
| Mean | 68.4% | 68.9% |
| Median | 68.4% | 67.4% |
| Interquartile 25% (IQ1) | 63.0% | 63.7% |
| Interquartile 75% (IQ3) | 76.1% | 73.2% |
| Interquartile Range (IQR) | 13.1% | 9.4% |
| Standard Deviation (Sample) | 11.2% | 8.7% |
| Standard Deviation (Population) | 11.2% | 8.6% |
Similar Demographics by Family Households
Demographics Similar to Indians (Asian) by Family Households
In terms of family households, the demographic groups most similar to Indians (Asian) are Spaniard (65.1%, a difference of 0.010%), Immigrants from Sri Lanka (65.1%, a difference of 0.020%), Haitian (65.2%, a difference of 0.040%), Chilean (65.2%, a difference of 0.040%), and English (65.1%, a difference of 0.070%).
| Demographics | Rating | Rank | Family Households |
| Swiss | 98.6 /100 | #96 | Exceptional 65.2% |
| Guatemalans | 98.6 /100 | #97 | Exceptional 65.2% |
| Immigrants | Syria | 98.4 /100 | #98 | Exceptional 65.2% |
| Central American Indians | 98.3 /100 | #99 | Exceptional 65.2% |
| Haitians | 98.1 /100 | #100 | Exceptional 65.2% |
| Chileans | 98.1 /100 | #101 | Exceptional 65.2% |
| Immigrants | Sri Lanka | 98.0 /100 | #102 | Exceptional 65.1% |
| Indians (Asian) | 97.9 /100 | #103 | Exceptional 65.1% |
| Spaniards | 97.8 /100 | #104 | Exceptional 65.1% |
| English | 97.4 /100 | #105 | Exceptional 65.1% |
| Whites/Caucasians | 97.3 /100 | #106 | Exceptional 65.1% |
| Alaska Natives | 97.3 /100 | #107 | Exceptional 65.1% |
| Palestinians | 97.2 /100 | #108 | Exceptional 65.1% |
| Immigrants | Guatemala | 96.9 /100 | #109 | Exceptional 65.0% |
| Scandinavians | 96.8 /100 | #110 | Exceptional 65.0% |
Demographics Similar to Immigrants from Lebanon by Family Households
In terms of family households, the demographic groups most similar to Immigrants from Lebanon are Immigrants from Guyana (65.5%, a difference of 0.010%), American (65.5%, a difference of 0.030%), Jordanian (65.5%, a difference of 0.040%), Puget Sound Salish (65.6%, a difference of 0.12%), and Immigrants from Costa Rica (65.6%, a difference of 0.13%).
| Demographics | Rating | Rank | Family Households |
| Houma | 99.9 /100 | #75 | Exceptional 65.7% |
| Immigrants | Azores | 99.8 /100 | #76 | Exceptional 65.6% |
| Immigrants | South America | 99.8 /100 | #77 | Exceptional 65.6% |
| Yaqui | 99.8 /100 | #78 | Exceptional 65.6% |
| Immigrants | Costa Rica | 99.8 /100 | #79 | Exceptional 65.6% |
| Puget Sound Salish | 99.8 /100 | #80 | Exceptional 65.6% |
| Jordanians | 99.7 /100 | #81 | Exceptional 65.5% |
| Immigrants | Lebanon | 99.7 /100 | #82 | Exceptional 65.5% |
| Immigrants | Guyana | 99.6 /100 | #83 | Exceptional 65.5% |
| Americans | 99.6 /100 | #84 | Exceptional 65.5% |
| Immigrants | Cambodia | 99.5 /100 | #85 | Exceptional 65.4% |
| Egyptians | 99.4 /100 | #86 | Exceptional 65.4% |
| Immigrants | Egypt | 99.2 /100 | #87 | Exceptional 65.3% |
| Immigrants | Haiti | 99.1 /100 | #88 | Exceptional 65.3% |
| Immigrants | Caribbean | 99.1 /100 | #89 | Exceptional 65.3% |