Indian (Asian) vs Czech Single Father Households
COMPARE
Indian (Asian)
Czech
Single Father Households
Single Father Households Comparison
Indians (Asian)
Czechs
1.9%
SINGLE FATHER HOUSEHOLDS
100.0/ 100
METRIC RATING
18th/ 347
METRIC RANK
2.3%
SINGLE FATHER HOUSEHOLDS
62.5/ 100
METRIC RATING
169th/ 347
METRIC RANK
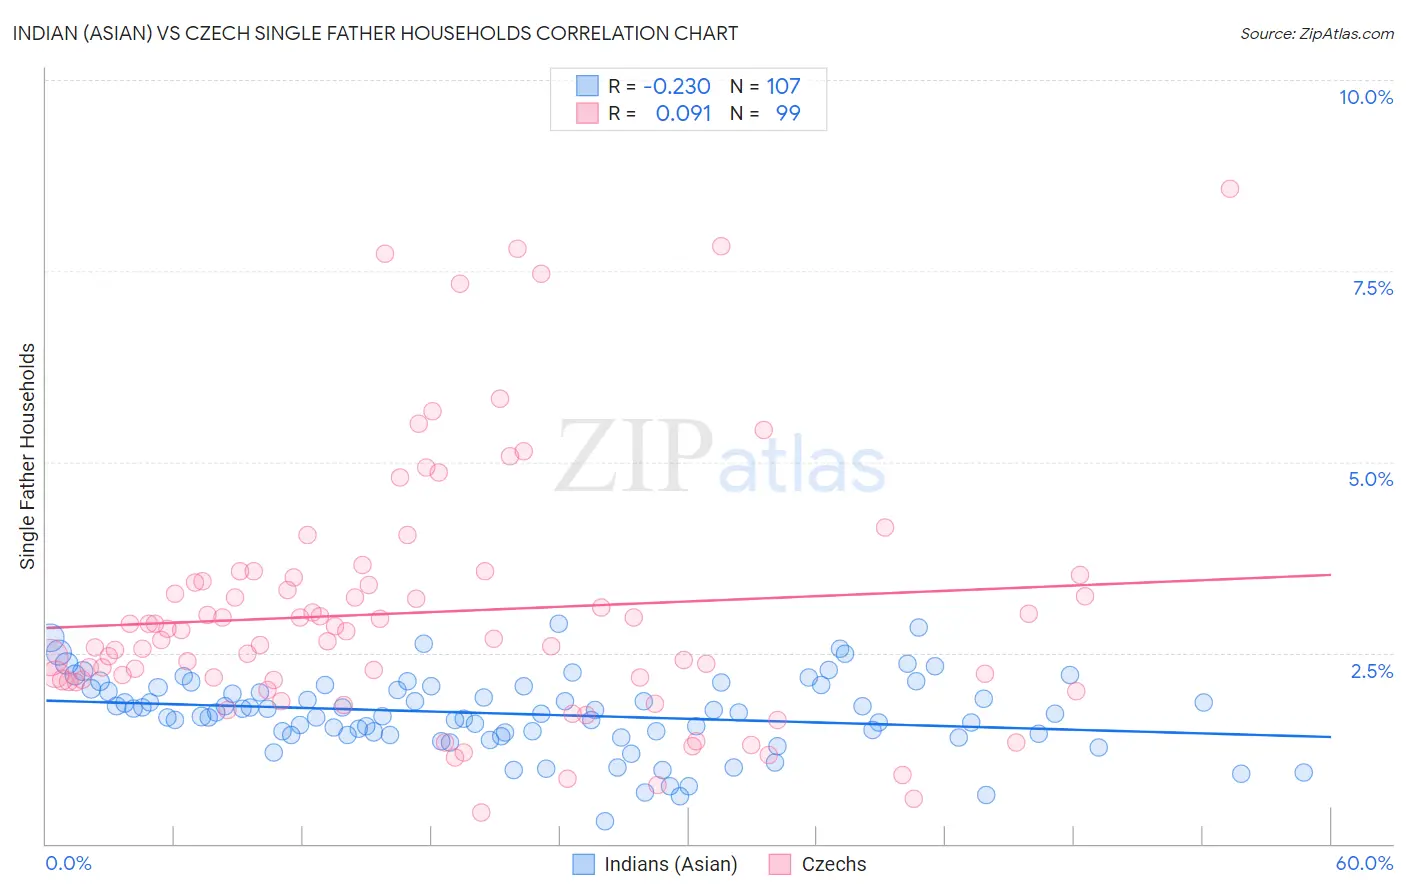
Indian (Asian) vs Czech Single Father Households Correlation Chart
The statistical analysis conducted on geographies consisting of 488,421,643 people shows a weak negative correlation between the proportion of Indians (Asian) and percentage of single father households in the United States with a correlation coefficient (R) of -0.230 and weighted average of 1.9%. Similarly, the statistical analysis conducted on geographies consisting of 477,253,750 people shows a slight positive correlation between the proportion of Czechs and percentage of single father households in the United States with a correlation coefficient (R) of 0.091 and weighted average of 2.3%, a difference of 21.5%.
Single Father Households Correlation Summary
| Measurement | Indian (Asian) | Czech |
| Minimum | 0.29% | 0.41% |
| Maximum | 2.9% | 8.6% |
| Range | 2.6% | 8.2% |
| Mean | 1.7% | 3.0% |
| Median | 1.7% | 2.7% |
| Interquartile 25% (IQ1) | 1.4% | 2.1% |
| Interquartile 75% (IQ3) | 2.0% | 3.4% |
| Interquartile Range (IQR) | 0.61% | 1.3% |
| Standard Deviation (Sample) | 0.49% | 1.7% |
| Standard Deviation (Population) | 0.49% | 1.6% |
Similar Demographics by Single Father Households
Demographics Similar to Indians (Asian) by Single Father Households
In terms of single father households, the demographic groups most similar to Indians (Asian) are Immigrants from India (1.9%, a difference of 0.50%), Immigrants from Iran (1.9%, a difference of 0.72%), Iranian (1.9%, a difference of 0.84%), Thai (1.9%, a difference of 0.91%), and Immigrants from Eastern Asia (1.9%, a difference of 0.93%).
| Demographics | Rating | Rank | Single Father Households |
| Immigrants | Belarus | 100.0 /100 | #11 | Exceptional 1.9% |
| Immigrants | Greece | 100.0 /100 | #12 | Exceptional 1.9% |
| Immigrants | Singapore | 100.0 /100 | #13 | Exceptional 1.9% |
| Immigrants | Lithuania | 100.0 /100 | #14 | Exceptional 1.9% |
| Immigrants | Eastern Asia | 100.0 /100 | #15 | Exceptional 1.9% |
| Immigrants | Iran | 100.0 /100 | #16 | Exceptional 1.9% |
| Immigrants | India | 100.0 /100 | #17 | Exceptional 1.9% |
| Indians (Asian) | 100.0 /100 | #18 | Exceptional 1.9% |
| Iranians | 100.0 /100 | #19 | Exceptional 1.9% |
| Thais | 100.0 /100 | #20 | Exceptional 1.9% |
| Immigrants | Albania | 100.0 /100 | #21 | Exceptional 1.9% |
| Immigrants | Latvia | 100.0 /100 | #22 | Exceptional 1.9% |
| Immigrants | Croatia | 100.0 /100 | #23 | Exceptional 2.0% |
| Immigrants | Russia | 100.0 /100 | #24 | Exceptional 2.0% |
| Eastern Europeans | 100.0 /100 | #25 | Exceptional 2.0% |
Demographics Similar to Czechs by Single Father Households
In terms of single father households, the demographic groups most similar to Czechs are Ugandan (2.3%, a difference of 0.020%), Icelander (2.3%, a difference of 0.040%), Swedish (2.3%, a difference of 0.070%), South American (2.3%, a difference of 0.14%), and Czechoslovakian (2.3%, a difference of 0.29%).
| Demographics | Rating | Rank | Single Father Households |
| Scottish | 72.8 /100 | #162 | Good 2.3% |
| Irish | 72.1 /100 | #163 | Good 2.3% |
| Pakistanis | 70.6 /100 | #164 | Good 2.3% |
| Scotch-Irish | 69.4 /100 | #165 | Good 2.3% |
| English | 68.6 /100 | #166 | Good 2.3% |
| South Americans | 64.3 /100 | #167 | Good 2.3% |
| Icelanders | 63.1 /100 | #168 | Good 2.3% |
| Czechs | 62.5 /100 | #169 | Good 2.3% |
| Ugandans | 62.2 /100 | #170 | Good 2.3% |
| Swedes | 61.6 /100 | #171 | Good 2.3% |
| Czechoslovakians | 58.9 /100 | #172 | Average 2.3% |
| Celtics | 55.4 /100 | #173 | Average 2.3% |
| Afghans | 50.0 /100 | #174 | Average 2.3% |
| Immigrants | Jamaica | 49.1 /100 | #175 | Average 2.3% |
| Danes | 48.2 /100 | #176 | Average 2.3% |