Immigrants from Zimbabwe vs Slavic Single Father Households
COMPARE
Immigrants from Zimbabwe
Slavic
Single Father Households
Single Father Households Comparison
Immigrants from Zimbabwe
Slavs
2.2%
SINGLE FATHER HOUSEHOLDS
90.2/ 100
METRIC RATING
145th/ 347
METRIC RANK
2.2%
SINGLE FATHER HOUSEHOLDS
88.9/ 100
METRIC RATING
147th/ 347
METRIC RANK
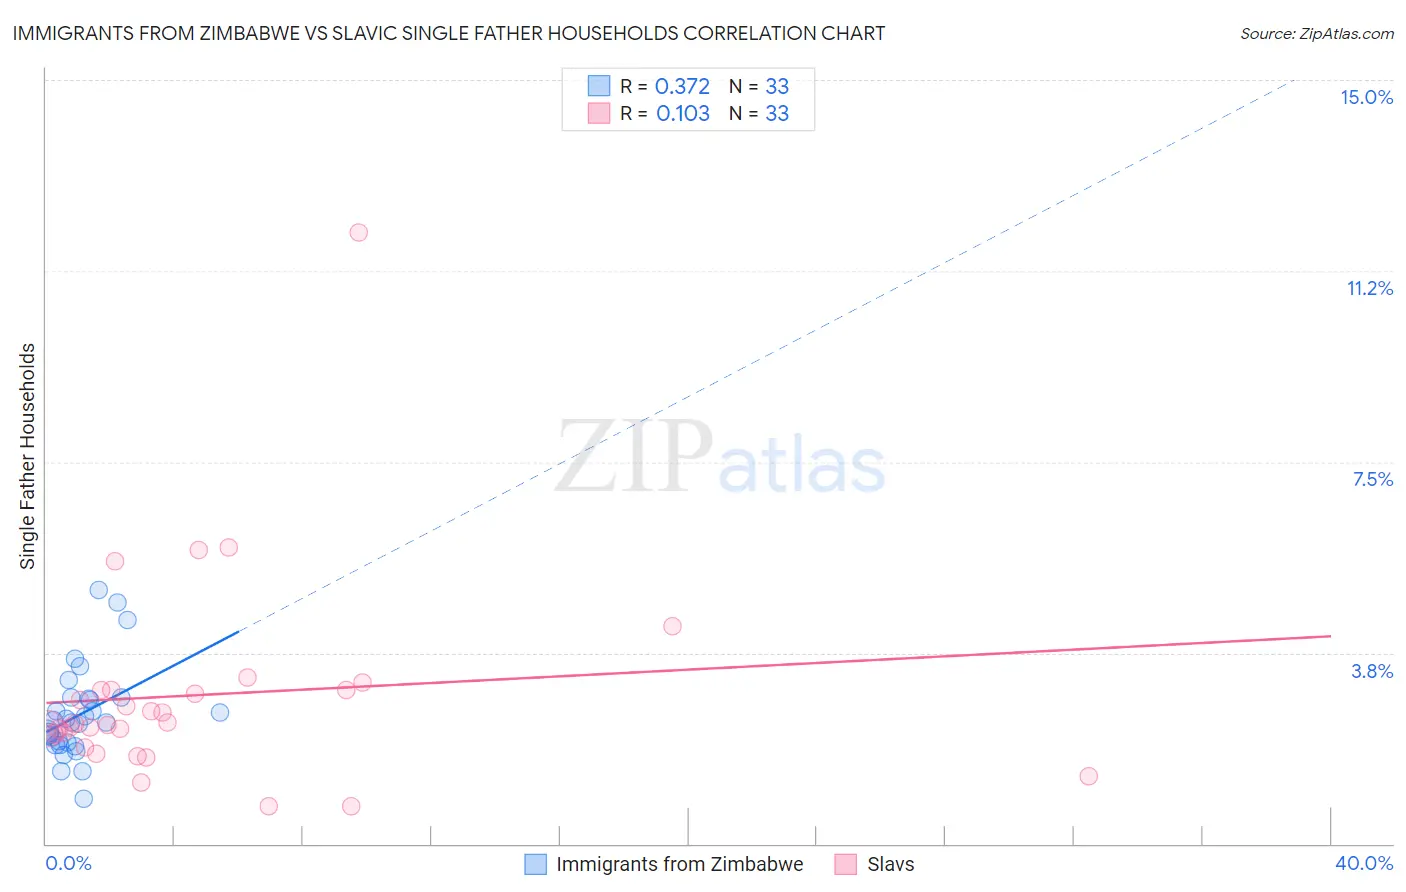
Immigrants from Zimbabwe vs Slavic Single Father Households Correlation Chart
The statistical analysis conducted on geographies consisting of 117,591,458 people shows a mild positive correlation between the proportion of Immigrants from Zimbabwe and percentage of single father households in the United States with a correlation coefficient (R) of 0.372 and weighted average of 2.2%. Similarly, the statistical analysis conducted on geographies consisting of 269,247,483 people shows a poor positive correlation between the proportion of Slavs and percentage of single father households in the United States with a correlation coefficient (R) of 0.103 and weighted average of 2.2%, a difference of 0.26%.
Single Father Households Correlation Summary
| Measurement | Immigrants from Zimbabwe | Slavic |
| Minimum | 0.87% | 0.74% |
| Maximum | 5.0% | 12.0% |
| Range | 4.1% | 11.3% |
| Mean | 2.5% | 2.9% |
| Median | 2.4% | 2.4% |
| Interquartile 25% (IQ1) | 2.0% | 2.0% |
| Interquartile 75% (IQ3) | 2.9% | 3.0% |
| Interquartile Range (IQR) | 0.89% | 1.0% |
| Standard Deviation (Sample) | 0.90% | 2.0% |
| Standard Deviation (Population) | 0.89% | 2.0% |
Demographics Similar to Immigrants from Zimbabwe and Slavs by Single Father Households
In terms of single father households, the demographic groups most similar to Immigrants from Zimbabwe are Northern European (2.2%, a difference of 0.080%), Slovak (2.2%, a difference of 0.11%), South American Indian (2.3%, a difference of 0.35%), Senegalese (2.3%, a difference of 0.36%), and Immigrants from Nepal (2.2%, a difference of 0.46%). Similarly, the demographic groups most similar to Slavs are South American Indian (2.3%, a difference of 0.090%), Senegalese (2.3%, a difference of 0.10%), Northern European (2.2%, a difference of 0.18%), Slovak (2.2%, a difference of 0.37%), and Venezuelan (2.3%, a difference of 0.49%).
| Demographics | Rating | Rank | Single Father Households |
| Chileans | 94.5 /100 | #136 | Exceptional 2.2% |
| Austrians | 94.2 /100 | #137 | Exceptional 2.2% |
| West Indians | 94.1 /100 | #138 | Exceptional 2.2% |
| Brazilians | 92.8 /100 | #139 | Exceptional 2.2% |
| British | 92.8 /100 | #140 | Exceptional 2.2% |
| Laotians | 92.5 /100 | #141 | Exceptional 2.2% |
| Luxembourgers | 92.3 /100 | #142 | Exceptional 2.2% |
| Immigrants | Nepal | 92.1 /100 | #143 | Exceptional 2.2% |
| Slovaks | 90.7 /100 | #144 | Exceptional 2.2% |
| Immigrants | Zimbabwe | 90.2 /100 | #145 | Exceptional 2.2% |
| Northern Europeans | 89.8 /100 | #146 | Excellent 2.2% |
| Slavs | 88.9 /100 | #147 | Excellent 2.2% |
| South American Indians | 88.5 /100 | #148 | Excellent 2.3% |
| Senegalese | 88.4 /100 | #149 | Excellent 2.3% |
| Venezuelans | 86.2 /100 | #150 | Excellent 2.3% |
| Immigrants | Syria | 84.8 /100 | #151 | Excellent 2.3% |
| Immigrants | Venezuela | 83.2 /100 | #152 | Excellent 2.3% |
| Immigrants | Germany | 82.8 /100 | #153 | Excellent 2.3% |
| Bolivians | 81.0 /100 | #154 | Excellent 2.3% |
| Europeans | 80.9 /100 | #155 | Excellent 2.3% |
| Immigrants | South America | 79.9 /100 | #156 | Good 2.3% |