Immigrants from Zaire vs Immigrants from Dominica Divorced or Separated
COMPARE
Immigrants from Zaire
Immigrants from Dominica
Divorced or Separated
Divorced or Separated Comparison
Immigrants from Zaire
Immigrants from Dominica
12.7%
DIVORCED OR SEPARATED
0.2/ 100
METRIC RATING
280th/ 347
METRIC RANK
12.6%
DIVORCED OR SEPARATED
0.5/ 100
METRIC RATING
261st/ 347
METRIC RANK
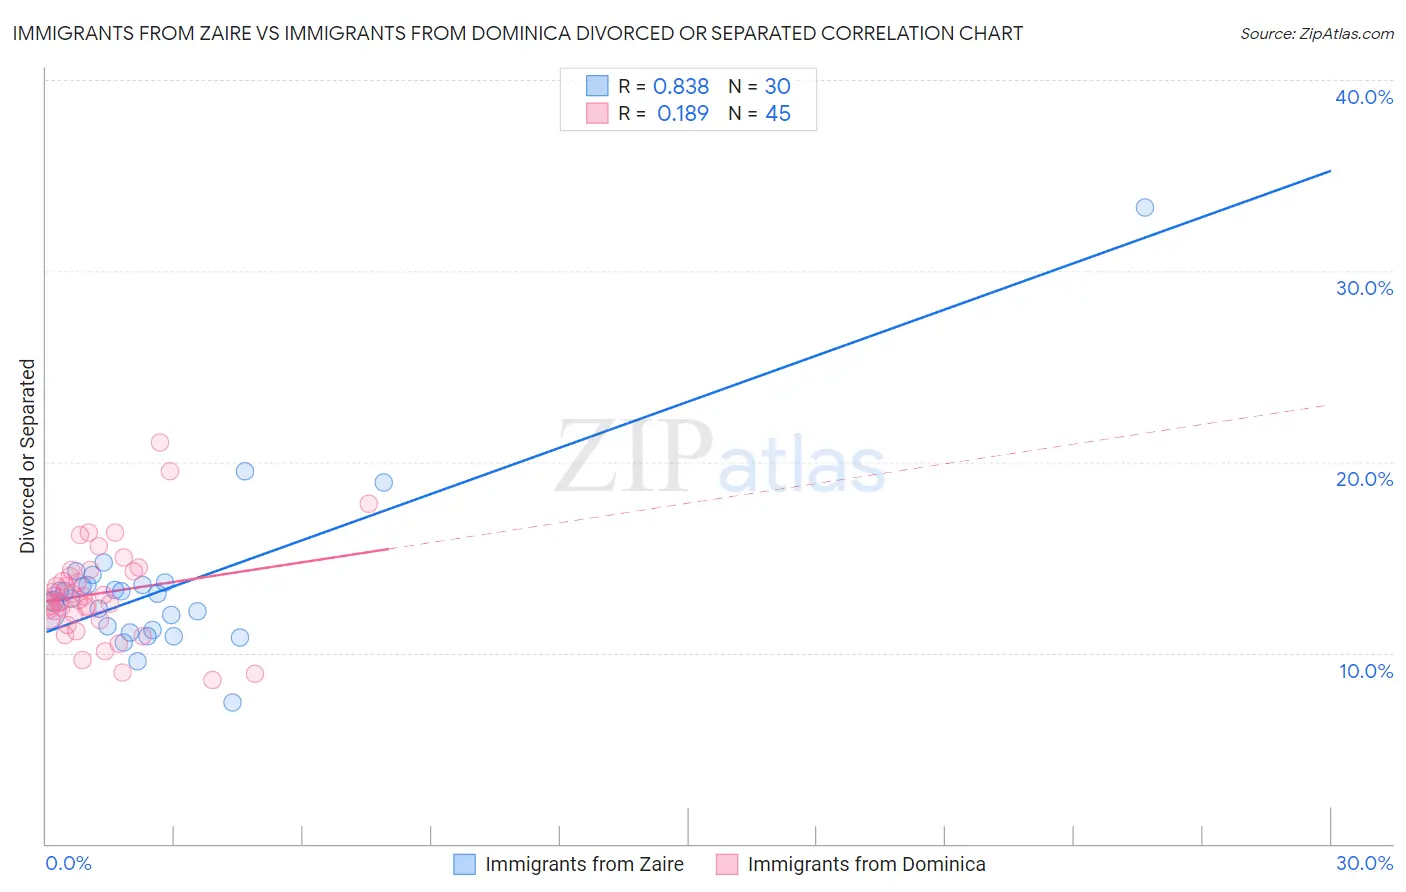
Immigrants from Zaire vs Immigrants from Dominica Divorced or Separated Correlation Chart
The statistical analysis conducted on geographies consisting of 107,244,131 people shows a very strong positive correlation between the proportion of Immigrants from Zaire and percentage of population currently divorced or separated in the United States with a correlation coefficient (R) of 0.838 and weighted average of 12.7%. Similarly, the statistical analysis conducted on geographies consisting of 83,792,024 people shows a poor positive correlation between the proportion of Immigrants from Dominica and percentage of population currently divorced or separated in the United States with a correlation coefficient (R) of 0.189 and weighted average of 12.6%, a difference of 0.96%.
Divorced or Separated Correlation Summary
| Measurement | Immigrants from Zaire | Immigrants from Dominica |
| Minimum | 7.4% | 8.6% |
| Maximum | 33.3% | 21.0% |
| Range | 25.9% | 12.4% |
| Mean | 13.4% | 13.1% |
| Median | 13.0% | 12.7% |
| Interquartile 25% (IQ1) | 11.2% | 11.8% |
| Interquartile 75% (IQ3) | 13.6% | 14.3% |
| Interquartile Range (IQR) | 2.4% | 2.5% |
| Standard Deviation (Sample) | 4.4% | 2.5% |
| Standard Deviation (Population) | 4.3% | 2.5% |
Demographics Similar to Immigrants from Zaire and Immigrants from Dominica by Divorced or Separated
In terms of divorced or separated, the demographic groups most similar to Immigrants from Zaire are Immigrants from Dominican Republic (12.7%, a difference of 0.070%), Lumbee (12.7%, a difference of 0.080%), Dominican (12.7%, a difference of 0.23%), Spaniard (12.7%, a difference of 0.28%), and Central American Indian (12.7%, a difference of 0.35%). Similarly, the demographic groups most similar to Immigrants from Dominica are Immigrants from Uruguay (12.6%, a difference of 0.030%), Basque (12.6%, a difference of 0.060%), Immigrants from Panama (12.6%, a difference of 0.11%), English (12.6%, a difference of 0.13%), and Immigrants from Senegal (12.6%, a difference of 0.15%).
| Demographics | Rating | Rank | Divorced or Separated |
| Immigrants | Uruguay | 0.6 /100 | #260 | Tragic 12.6% |
| Immigrants | Dominica | 0.5 /100 | #261 | Tragic 12.6% |
| Basques | 0.5 /100 | #262 | Tragic 12.6% |
| Immigrants | Panama | 0.5 /100 | #263 | Tragic 12.6% |
| English | 0.5 /100 | #264 | Tragic 12.6% |
| Immigrants | Senegal | 0.5 /100 | #265 | Tragic 12.6% |
| Whites/Caucasians | 0.5 /100 | #266 | Tragic 12.6% |
| Scottish | 0.4 /100 | #267 | Tragic 12.6% |
| Fijians | 0.4 /100 | #268 | Tragic 12.6% |
| Immigrants | Liberia | 0.4 /100 | #269 | Tragic 12.6% |
| Ute | 0.4 /100 | #270 | Tragic 12.6% |
| Panamanians | 0.3 /100 | #271 | Tragic 12.7% |
| Immigrants | Middle Africa | 0.3 /100 | #272 | Tragic 12.7% |
| Immigrants | Micronesia | 0.3 /100 | #273 | Tragic 12.7% |
| Bermudans | 0.3 /100 | #274 | Tragic 12.7% |
| Central American Indians | 0.3 /100 | #275 | Tragic 12.7% |
| Spaniards | 0.2 /100 | #276 | Tragic 12.7% |
| Dominicans | 0.2 /100 | #277 | Tragic 12.7% |
| Lumbee | 0.2 /100 | #278 | Tragic 12.7% |
| Immigrants | Dominican Republic | 0.2 /100 | #279 | Tragic 12.7% |
| Immigrants | Zaire | 0.2 /100 | #280 | Tragic 12.7% |