Immigrants from Yemen vs Menominee Married-couple Households
COMPARE
Immigrants from Yemen
Menominee
Married-couple Households
Married-couple Households Comparison
Immigrants from Yemen
Menominee
42.0%
MARRIED-COUPLE HOUSEHOLDS
0.0/ 100
METRIC RATING
294th/ 347
METRIC RANK
42.0%
MARRIED-COUPLE HOUSEHOLDS
0.0/ 100
METRIC RATING
293rd/ 347
METRIC RANK
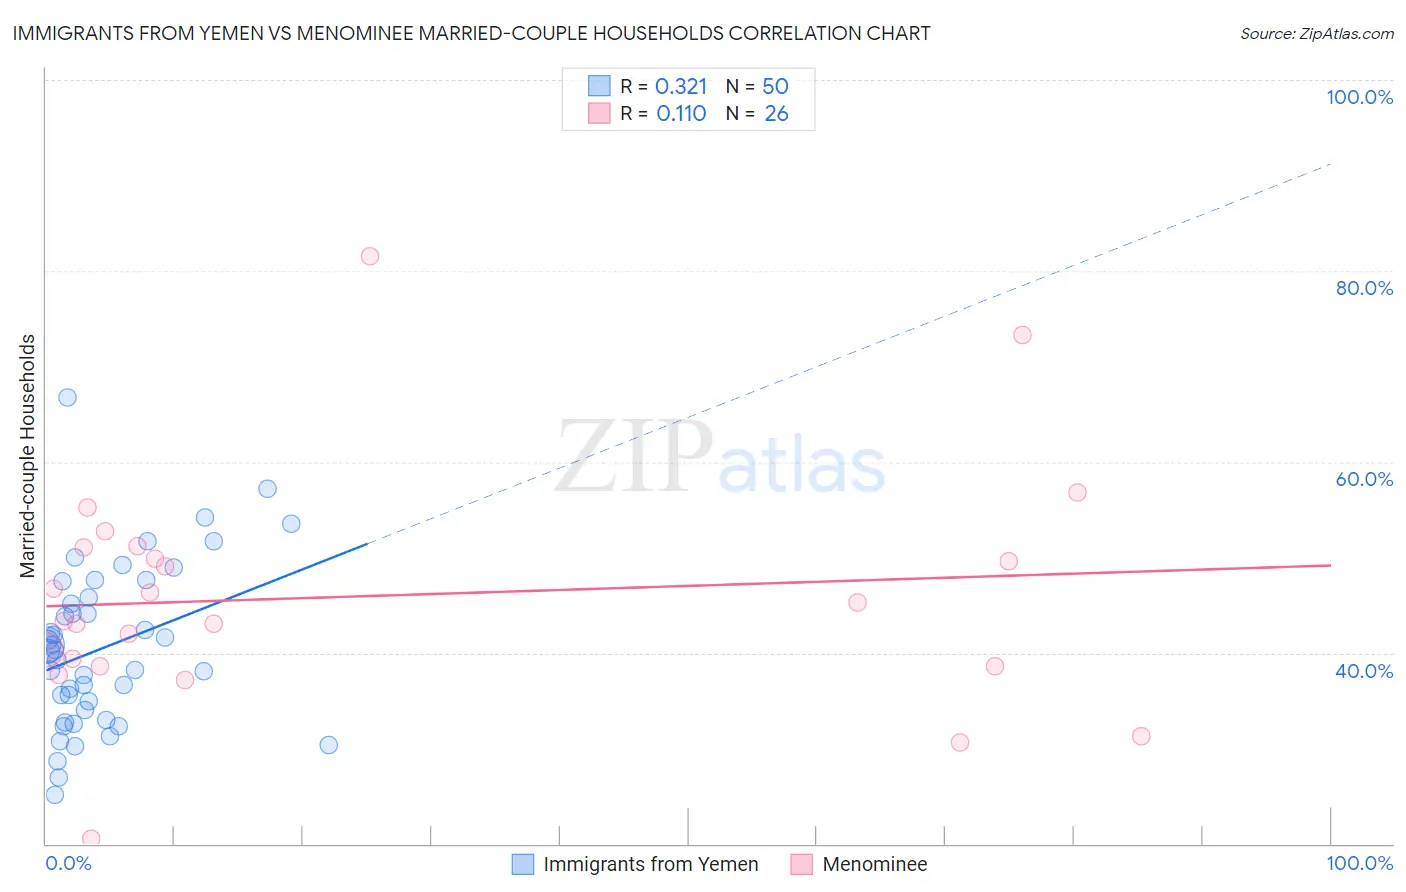
Immigrants from Yemen vs Menominee Married-couple Households Correlation Chart
The statistical analysis conducted on geographies consisting of 82,431,124 people shows a mild positive correlation between the proportion of Immigrants from Yemen and percentage of married-couple family households in the United States with a correlation coefficient (R) of 0.321 and weighted average of 42.0%. Similarly, the statistical analysis conducted on geographies consisting of 45,777,849 people shows a poor positive correlation between the proportion of Menominee and percentage of married-couple family households in the United States with a correlation coefficient (R) of 0.110 and weighted average of 42.0%, a difference of 0.0%.
Married-couple Households Correlation Summary
| Measurement | Immigrants from Yemen | Menominee |
| Minimum | 25.1% | 20.5% |
| Maximum | 66.7% | 81.5% |
| Range | 41.6% | 61.0% |
| Mean | 40.5% | 45.9% |
| Median | 40.2% | 44.3% |
| Interquartile 25% (IQ1) | 34.0% | 38.6% |
| Interquartile 75% (IQ3) | 45.8% | 51.0% |
| Interquartile Range (IQR) | 11.8% | 12.4% |
| Standard Deviation (Sample) | 8.5% | 12.4% |
| Standard Deviation (Population) | 8.4% | 12.1% |
Demographics Similar to Immigrants from Yemen and Menominee by Married-couple Households
In terms of married-couple households, the demographic groups most similar to Immigrants from Yemen are Kiowa (42.0%, a difference of 0.0%), Immigrants from Sudan (41.9%, a difference of 0.11%), Indonesian (42.0%, a difference of 0.12%), Paiute (42.1%, a difference of 0.16%), and Honduran (42.1%, a difference of 0.17%). Similarly, the demographic groups most similar to Menominee are Kiowa (42.0%, a difference of 0.0%), Indonesian (42.0%, a difference of 0.11%), Immigrants from Sudan (41.9%, a difference of 0.11%), Paiute (42.1%, a difference of 0.16%), and Honduran (42.1%, a difference of 0.17%).
| Demographics | Rating | Rank | Married-couple Households |
| Inupiat | 0.0 /100 | #283 | Tragic 42.4% |
| Cheyenne | 0.0 /100 | #284 | Tragic 42.3% |
| Ghanaians | 0.0 /100 | #285 | Tragic 42.2% |
| Belizeans | 0.0 /100 | #286 | Tragic 42.2% |
| Chippewa | 0.0 /100 | #287 | Tragic 42.1% |
| Immigrants | Eritrea | 0.0 /100 | #288 | Tragic 42.1% |
| Sudanese | 0.0 /100 | #289 | Tragic 42.1% |
| Hondurans | 0.0 /100 | #290 | Tragic 42.1% |
| Paiute | 0.0 /100 | #291 | Tragic 42.1% |
| Indonesians | 0.0 /100 | #292 | Tragic 42.0% |
| Menominee | 0.0 /100 | #293 | Tragic 42.0% |
| Immigrants | Yemen | 0.0 /100 | #294 | Tragic 42.0% |
| Kiowa | 0.0 /100 | #295 | Tragic 42.0% |
| Immigrants | Sudan | 0.0 /100 | #296 | Tragic 41.9% |
| Arapaho | 0.0 /100 | #297 | Tragic 41.8% |
| Immigrants | Middle Africa | 0.0 /100 | #298 | Tragic 41.8% |
| Immigrants | Ghana | 0.0 /100 | #299 | Tragic 41.8% |
| Immigrants | Belize | 0.0 /100 | #300 | Tragic 41.8% |
| Immigrants | Bahamas | 0.0 /100 | #301 | Tragic 41.7% |
| Immigrants | Honduras | 0.0 /100 | #302 | Tragic 41.6% |
| Sub-Saharan Africans | 0.0 /100 | #303 | Tragic 41.6% |