Immigrants from Uzbekistan vs Paraguayan Births to Unmarried Women
COMPARE
Immigrants from Uzbekistan
Paraguayan
Births to Unmarried Women
Births to Unmarried Women Comparison
Immigrants from Uzbekistan
Paraguayans
25.8%
BIRTHS TO UNMARRIED WOMEN
100.0/ 100
METRIC RATING
17th/ 347
METRIC RANK
29.7%
BIRTHS TO UNMARRIED WOMEN
93.5/ 100
METRIC RATING
108th/ 347
METRIC RANK
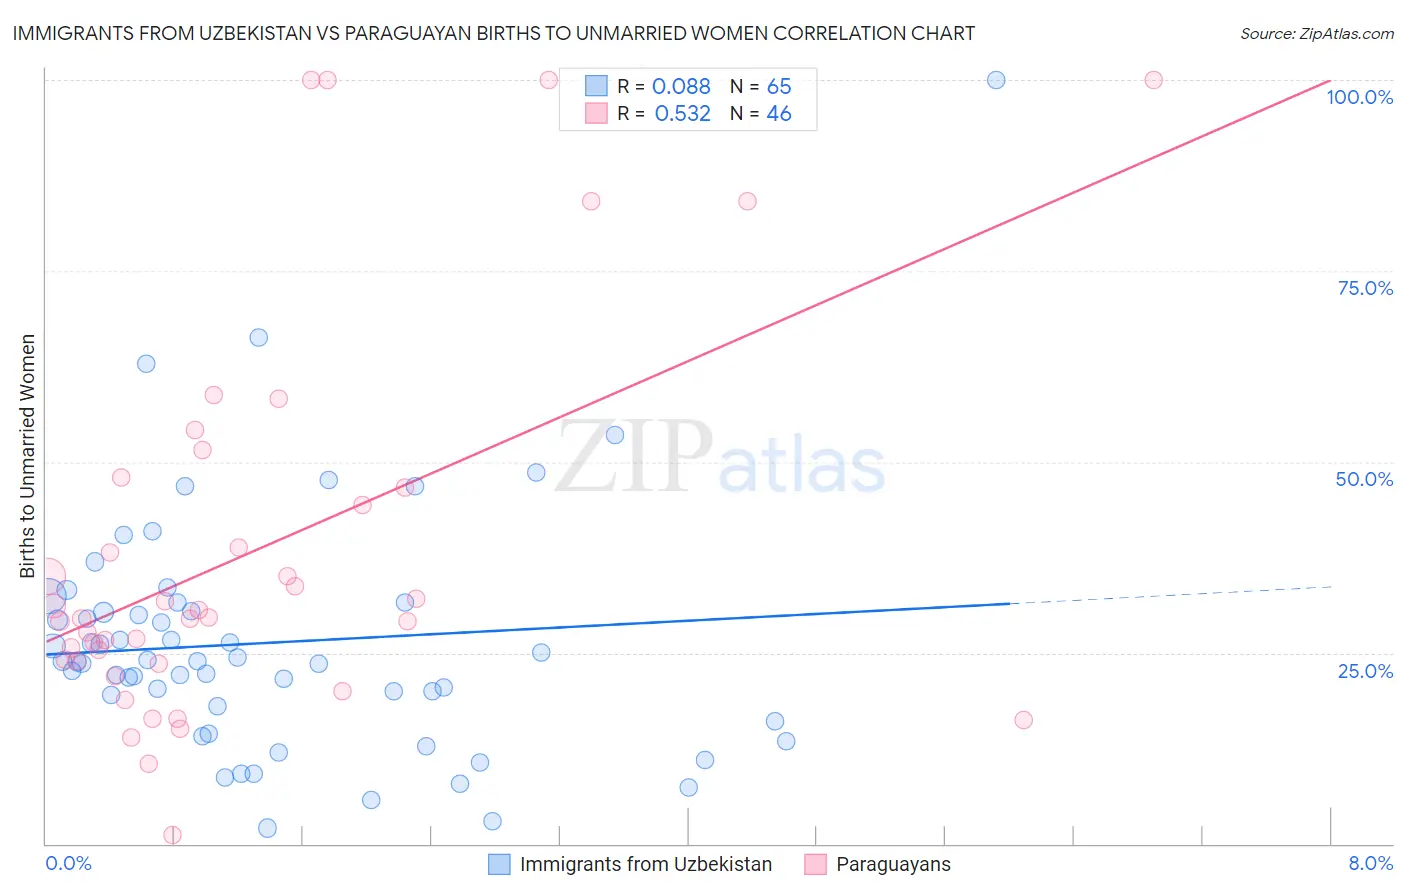
Immigrants from Uzbekistan vs Paraguayan Births to Unmarried Women Correlation Chart
The statistical analysis conducted on geographies consisting of 114,110,355 people shows a slight positive correlation between the proportion of Immigrants from Uzbekistan and percentage of births to unmarried women in the United States with a correlation coefficient (R) of 0.088 and weighted average of 25.8%. Similarly, the statistical analysis conducted on geographies consisting of 92,447,839 people shows a substantial positive correlation between the proportion of Paraguayans and percentage of births to unmarried women in the United States with a correlation coefficient (R) of 0.532 and weighted average of 29.7%, a difference of 15.1%.
Births to Unmarried Women Correlation Summary
| Measurement | Immigrants from Uzbekistan | Paraguayan |
| Minimum | 2.0% | 1.1% |
| Maximum | 100.0% | 100.0% |
| Range | 98.0% | 98.9% |
| Mean | 26.3% | 38.3% |
| Median | 23.9% | 29.5% |
| Interquartile 25% (IQ1) | 17.0% | 23.9% |
| Interquartile 75% (IQ3) | 31.0% | 46.7% |
| Interquartile Range (IQR) | 14.0% | 22.8% |
| Standard Deviation (Sample) | 16.2% | 25.3% |
| Standard Deviation (Population) | 16.0% | 25.0% |
Similar Demographics by Births to Unmarried Women
Demographics Similar to Immigrants from Uzbekistan by Births to Unmarried Women
In terms of births to unmarried women, the demographic groups most similar to Immigrants from Uzbekistan are Immigrants from Belarus (25.6%, a difference of 0.57%), Immigrants from Singapore (25.6%, a difference of 0.62%), Immigrants from Armenia (26.1%, a difference of 1.1%), Armenian (26.2%, a difference of 1.7%), and Immigrants from Lebanon (25.3%, a difference of 1.8%).
| Demographics | Rating | Rank | Births to Unmarried Women |
| Immigrants | Eastern Asia | 100.0 /100 | #10 | Exceptional 25.0% |
| Immigrants | Israel | 100.0 /100 | #11 | Exceptional 25.1% |
| Indians (Asian) | 100.0 /100 | #12 | Exceptional 25.3% |
| Iranians | 100.0 /100 | #13 | Exceptional 25.3% |
| Immigrants | Lebanon | 100.0 /100 | #14 | Exceptional 25.3% |
| Immigrants | Singapore | 100.0 /100 | #15 | Exceptional 25.6% |
| Immigrants | Belarus | 100.0 /100 | #16 | Exceptional 25.6% |
| Immigrants | Uzbekistan | 100.0 /100 | #17 | Exceptional 25.8% |
| Immigrants | Armenia | 99.9 /100 | #18 | Exceptional 26.1% |
| Armenians | 99.9 /100 | #19 | Exceptional 26.2% |
| Immigrants | Korea | 99.9 /100 | #20 | Exceptional 26.3% |
| Soviet Union | 99.9 /100 | #21 | Exceptional 26.3% |
| Burmese | 99.9 /100 | #22 | Exceptional 26.4% |
| Immigrants | Japan | 99.9 /100 | #23 | Exceptional 26.4% |
| Immigrants | Australia | 99.9 /100 | #24 | Exceptional 26.6% |
Demographics Similar to Paraguayans by Births to Unmarried Women
In terms of births to unmarried women, the demographic groups most similar to Paraguayans are Greek (29.7%, a difference of 0.040%), Immigrants from Ethiopia (29.7%, a difference of 0.070%), Immigrants from Brazil (29.6%, a difference of 0.090%), Swedish (29.6%, a difference of 0.10%), and Immigrants from Hungary (29.7%, a difference of 0.20%).
| Demographics | Rating | Rank | Births to Unmarried Women |
| Immigrants | Northern Africa | 94.7 /100 | #101 | Exceptional 29.5% |
| Australians | 94.6 /100 | #102 | Exceptional 29.5% |
| Lebanese | 94.4 /100 | #103 | Exceptional 29.5% |
| Lithuanians | 94.4 /100 | #104 | Exceptional 29.6% |
| Immigrants | Nepal | 94.3 /100 | #105 | Exceptional 29.6% |
| Swedes | 93.8 /100 | #106 | Exceptional 29.6% |
| Immigrants | Brazil | 93.7 /100 | #107 | Exceptional 29.6% |
| Paraguayans | 93.5 /100 | #108 | Exceptional 29.7% |
| Greeks | 93.4 /100 | #109 | Exceptional 29.7% |
| Immigrants | Ethiopia | 93.4 /100 | #110 | Exceptional 29.7% |
| Immigrants | Hungary | 93.0 /100 | #111 | Exceptional 29.7% |
| Basques | 93.0 /100 | #112 | Exceptional 29.7% |
| Scandinavians | 92.7 /100 | #113 | Exceptional 29.8% |
| Immigrants | Croatia | 92.6 /100 | #114 | Exceptional 29.8% |
| Ethiopians | 91.9 /100 | #115 | Exceptional 29.8% |