Immigrants from Uzbekistan vs Immigrants from Sierra Leone Currently Married
COMPARE
Immigrants from Uzbekistan
Immigrants from Sierra Leone
Currently Married
Currently Married Comparison
Immigrants from Uzbekistan
Immigrants from Sierra Leone
46.9%
CURRENTLY MARRIED
66.0/ 100
METRIC RATING
160th/ 347
METRIC RANK
43.8%
CURRENTLY MARRIED
0.1/ 100
METRIC RATING
259th/ 347
METRIC RANK
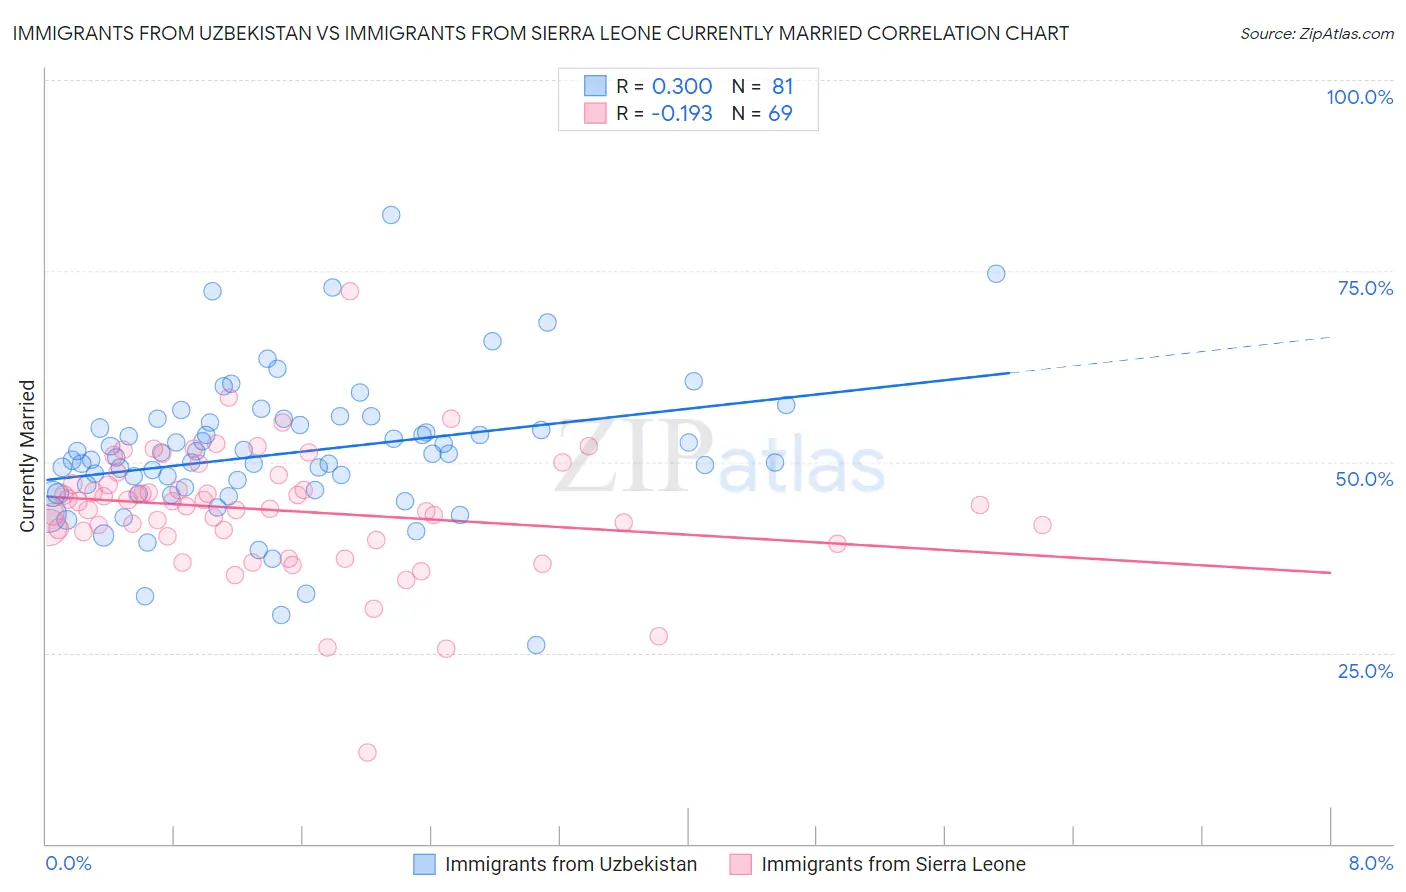
Immigrants from Uzbekistan vs Immigrants from Sierra Leone Currently Married Correlation Chart
The statistical analysis conducted on geographies consisting of 118,761,741 people shows a mild positive correlation between the proportion of Immigrants from Uzbekistan and percentage of population currently married in the United States with a correlation coefficient (R) of 0.300 and weighted average of 46.9%. Similarly, the statistical analysis conducted on geographies consisting of 101,652,138 people shows a poor negative correlation between the proportion of Immigrants from Sierra Leone and percentage of population currently married in the United States with a correlation coefficient (R) of -0.193 and weighted average of 43.8%, a difference of 7.1%.
Currently Married Correlation Summary
| Measurement | Immigrants from Uzbekistan | Immigrants from Sierra Leone |
| Minimum | 26.0% | 12.0% |
| Maximum | 82.3% | 72.3% |
| Range | 56.3% | 60.3% |
| Mean | 51.1% | 43.7% |
| Median | 50.5% | 44.4% |
| Interquartile 25% (IQ1) | 46.1% | 40.5% |
| Interquartile 75% (IQ3) | 55.0% | 47.7% |
| Interquartile Range (IQR) | 8.9% | 7.1% |
| Standard Deviation (Sample) | 9.3% | 8.4% |
| Standard Deviation (Population) | 9.3% | 8.3% |
Similar Demographics by Currently Married
Demographics Similar to Immigrants from Uzbekistan by Currently Married
In terms of currently married, the demographic groups most similar to Immigrants from Uzbekistan are Immigrants from Southern Europe (46.9%, a difference of 0.0%), Iraqi (46.9%, a difference of 0.020%), Nonimmigrants (46.9%, a difference of 0.020%), Cherokee (46.9%, a difference of 0.030%), and Delaware (46.9%, a difference of 0.050%).
| Demographics | Rating | Rank | Currently Married |
| Immigrants | Venezuela | 68.6 /100 | #153 | Good 47.0% |
| Albanians | 68.6 /100 | #154 | Good 47.0% |
| Arabs | 68.6 /100 | #155 | Good 47.0% |
| Spanish | 68.1 /100 | #156 | Good 47.0% |
| Immigrants | Switzerland | 67.8 /100 | #157 | Good 46.9% |
| Cherokee | 66.8 /100 | #158 | Good 46.9% |
| Iraqis | 66.4 /100 | #159 | Good 46.9% |
| Immigrants | Uzbekistan | 66.0 /100 | #160 | Good 46.9% |
| Immigrants | Southern Europe | 65.9 /100 | #161 | Good 46.9% |
| Immigrants | Nonimmigrants | 65.4 /100 | #162 | Good 46.9% |
| Delaware | 64.7 /100 | #163 | Good 46.9% |
| Immigrants | Western Asia | 64.2 /100 | #164 | Good 46.9% |
| Samoans | 59.8 /100 | #165 | Average 46.8% |
| Immigrants | Syria | 59.3 /100 | #166 | Average 46.8% |
| Spaniards | 58.8 /100 | #167 | Average 46.8% |
Demographics Similar to Immigrants from Sierra Leone by Currently Married
In terms of currently married, the demographic groups most similar to Immigrants from Sierra Leone are Immigrants from Latin America (43.8%, a difference of 0.060%), Immigrants from Nicaragua (43.7%, a difference of 0.11%), Ute (43.9%, a difference of 0.21%), Immigrants from Africa (43.9%, a difference of 0.22%), and Bangladeshi (43.7%, a difference of 0.25%).
| Demographics | Rating | Rank | Currently Married |
| Hispanics or Latinos | 0.3 /100 | #252 | Tragic 44.1% |
| Immigrants | Central America | 0.3 /100 | #253 | Tragic 44.1% |
| Vietnamese | 0.2 /100 | #254 | Tragic 44.0% |
| Yakama | 0.2 /100 | #255 | Tragic 44.0% |
| Shoshone | 0.2 /100 | #256 | Tragic 44.0% |
| Immigrants | Africa | 0.2 /100 | #257 | Tragic 43.9% |
| Ute | 0.2 /100 | #258 | Tragic 43.9% |
| Immigrants | Sierra Leone | 0.1 /100 | #259 | Tragic 43.8% |
| Immigrants | Latin America | 0.1 /100 | #260 | Tragic 43.8% |
| Immigrants | Nicaragua | 0.1 /100 | #261 | Tragic 43.7% |
| Bangladeshis | 0.1 /100 | #262 | Tragic 43.7% |
| Immigrants | Cuba | 0.1 /100 | #263 | Tragic 43.7% |
| Sudanese | 0.1 /100 | #264 | Tragic 43.7% |
| Immigrants | Bangladesh | 0.1 /100 | #265 | Tragic 43.6% |
| Ecuadorians | 0.1 /100 | #266 | Tragic 43.6% |