Immigrants from Ukraine vs Okinawan Family Households
COMPARE
Immigrants from Ukraine
Okinawan
Family Households
Family Households Comparison
Immigrants from Ukraine
Okinawans
64.2%
FAMILY HOUSEHOLDS
38.2/ 100
METRIC RATING
179th/ 347
METRIC RANK
62.5%
FAMILY HOUSEHOLDS
0.0/ 100
METRIC RATING
295th/ 347
METRIC RANK
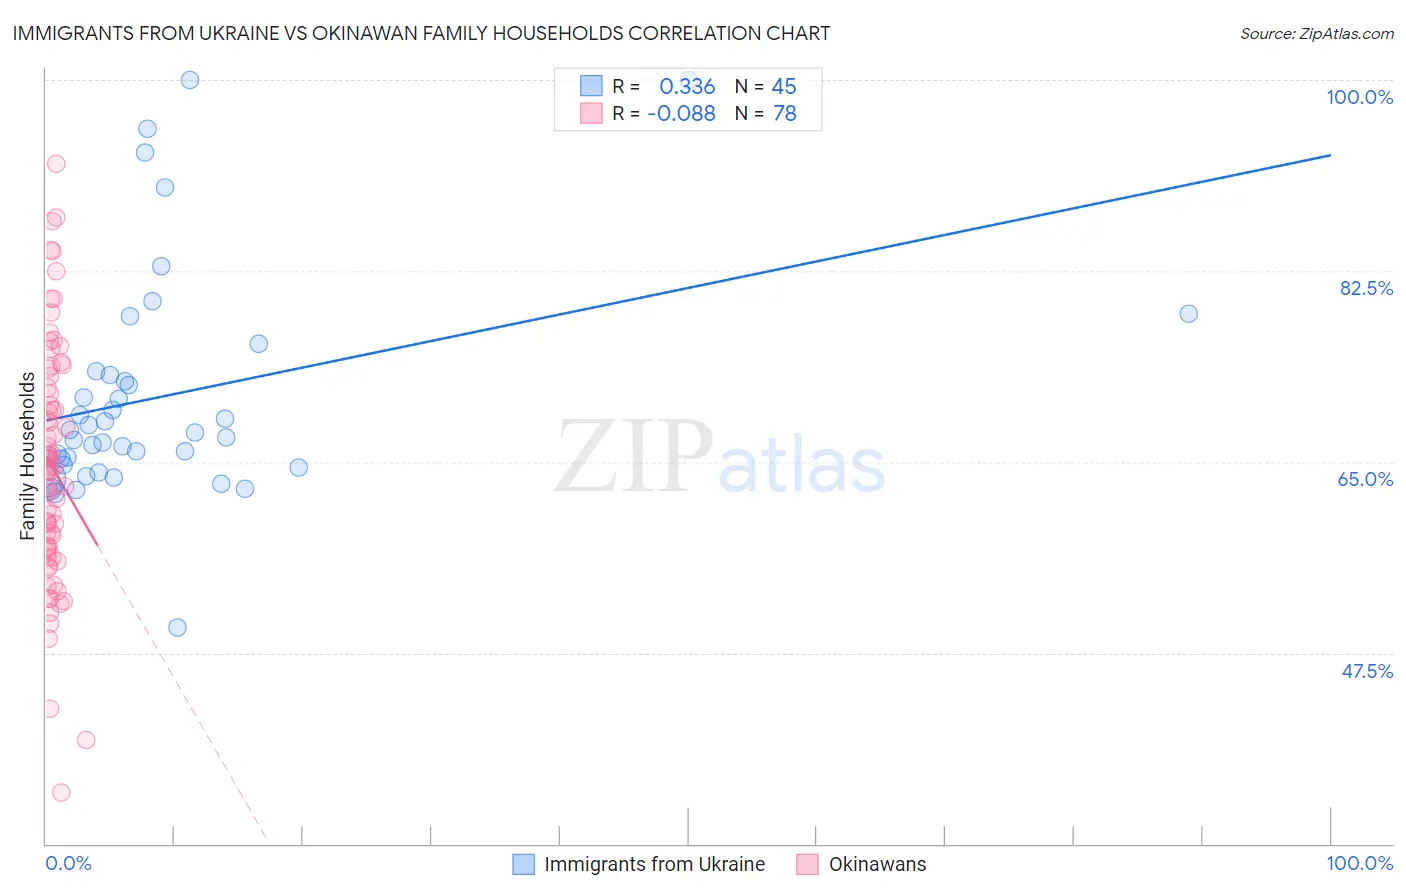
Immigrants from Ukraine vs Okinawan Family Households Correlation Chart
The statistical analysis conducted on geographies consisting of 289,649,929 people shows a mild positive correlation between the proportion of Immigrants from Ukraine and percentage of family households in the United States with a correlation coefficient (R) of 0.336 and weighted average of 64.2%. Similarly, the statistical analysis conducted on geographies consisting of 73,730,416 people shows a slight negative correlation between the proportion of Okinawans and percentage of family households in the United States with a correlation coefficient (R) of -0.088 and weighted average of 62.5%, a difference of 2.8%.
Family Households Correlation Summary
| Measurement | Immigrants from Ukraine | Okinawan |
| Minimum | 49.9% | 34.7% |
| Maximum | 100.0% | 92.3% |
| Range | 50.1% | 57.6% |
| Mean | 71.0% | 64.6% |
| Median | 67.7% | 64.3% |
| Interquartile 25% (IQ1) | 64.6% | 57.1% |
| Interquartile 75% (IQ3) | 73.1% | 71.8% |
| Interquartile Range (IQR) | 8.5% | 14.6% |
| Standard Deviation (Sample) | 10.5% | 11.1% |
| Standard Deviation (Population) | 10.4% | 11.0% |
Similar Demographics by Family Households
Demographics Similar to Immigrants from Ukraine by Family Households
In terms of family households, the demographic groups most similar to Immigrants from Ukraine are Jamaican (64.2%, a difference of 0.030%), Immigrants from Honduras (64.2%, a difference of 0.050%), Immigrants from Trinidad and Tobago (64.2%, a difference of 0.050%), Ukrainian (64.2%, a difference of 0.050%), and Immigrants from Micronesia (64.2%, a difference of 0.060%).
| Demographics | Rating | Rank | Family Households |
| Dutch West Indians | 53.9 /100 | #172 | Average 64.3% |
| Immigrants | Sierra Leone | 52.5 /100 | #173 | Average 64.3% |
| Immigrants | Germany | 50.0 /100 | #174 | Average 64.3% |
| Bangladeshis | 44.3 /100 | #175 | Average 64.3% |
| Vietnamese | 43.6 /100 | #176 | Average 64.2% |
| Immigrants | Micronesia | 42.3 /100 | #177 | Average 64.2% |
| Jamaicans | 40.6 /100 | #178 | Average 64.2% |
| Immigrants | Ukraine | 38.2 /100 | #179 | Fair 64.2% |
| Immigrants | Honduras | 35.0 /100 | #180 | Fair 64.2% |
| Immigrants | Trinidad and Tobago | 34.9 /100 | #181 | Fair 64.2% |
| Ukrainians | 34.6 /100 | #182 | Fair 64.2% |
| Creek | 34.1 /100 | #183 | Fair 64.2% |
| Puerto Ricans | 33.4 /100 | #184 | Fair 64.2% |
| Immigrants | Iran | 30.4 /100 | #185 | Fair 64.1% |
| Spanish Americans | 30.1 /100 | #186 | Fair 64.1% |
Demographics Similar to Okinawans by Family Households
In terms of family households, the demographic groups most similar to Okinawans are Barbadian (62.5%, a difference of 0.010%), Slovene (62.4%, a difference of 0.010%), French American Indian (62.4%, a difference of 0.020%), Immigrants from Spain (62.4%, a difference of 0.050%), and Immigrants from Sweden (62.5%, a difference of 0.080%).
| Demographics | Rating | Rank | Family Households |
| Immigrants | Uganda | 0.1 /100 | #288 | Tragic 62.7% |
| Immigrants | Nepal | 0.1 /100 | #289 | Tragic 62.7% |
| Immigrants | Grenada | 0.0 /100 | #290 | Tragic 62.6% |
| U.S. Virgin Islanders | 0.0 /100 | #291 | Tragic 62.6% |
| Immigrants | Burma/Myanmar | 0.0 /100 | #292 | Tragic 62.6% |
| Immigrants | Sweden | 0.0 /100 | #293 | Tragic 62.5% |
| Barbadians | 0.0 /100 | #294 | Tragic 62.5% |
| Okinawans | 0.0 /100 | #295 | Tragic 62.5% |
| Slovenes | 0.0 /100 | #296 | Tragic 62.4% |
| French American Indians | 0.0 /100 | #297 | Tragic 62.4% |
| Immigrants | Spain | 0.0 /100 | #298 | Tragic 62.4% |
| Immigrants | Kuwait | 0.0 /100 | #299 | Tragic 62.4% |
| Immigrants | Africa | 0.0 /100 | #300 | Tragic 62.4% |
| Immigrants | Albania | 0.0 /100 | #301 | Tragic 62.4% |
| Immigrants | Kenya | 0.0 /100 | #302 | Tragic 62.3% |