Immigrants from Uganda vs Shoshone Single Mother Households
COMPARE
Immigrants from Uganda
Shoshone
Single Mother Households
Single Mother Households Comparison
Immigrants from Uganda
Shoshone
6.6%
SINGLE MOTHER HOUSEHOLDS
18.3/ 100
METRIC RATING
194th/ 347
METRIC RANK
6.8%
SINGLE MOTHER HOUSEHOLDS
5.7/ 100
METRIC RATING
215th/ 347
METRIC RANK
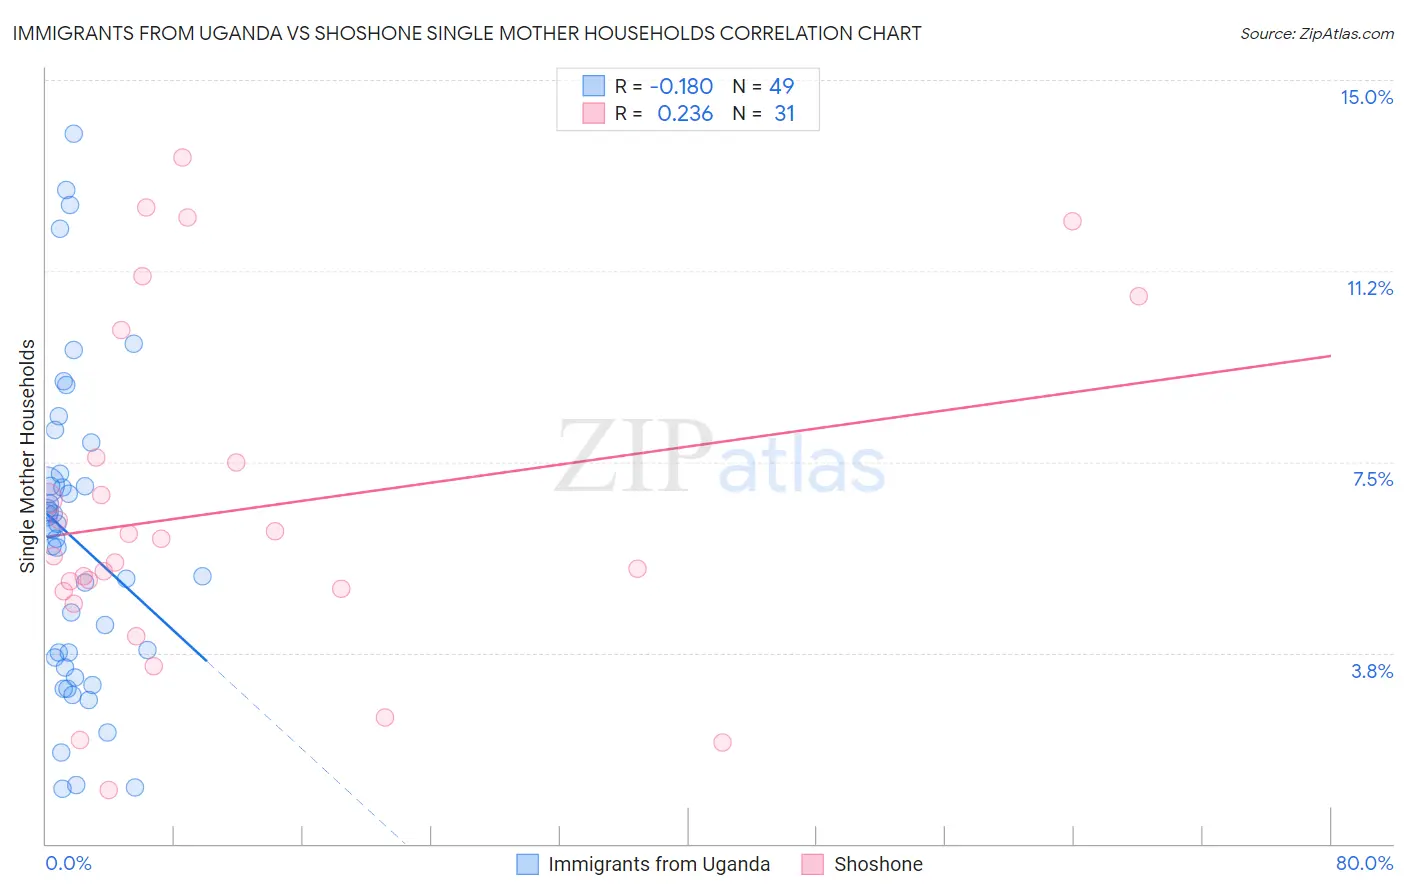
Immigrants from Uganda vs Shoshone Single Mother Households Correlation Chart
The statistical analysis conducted on geographies consisting of 125,934,931 people shows a poor negative correlation between the proportion of Immigrants from Uganda and percentage of single mother households in the United States with a correlation coefficient (R) of -0.180 and weighted average of 6.6%. Similarly, the statistical analysis conducted on geographies consisting of 66,546,675 people shows a weak positive correlation between the proportion of Shoshone and percentage of single mother households in the United States with a correlation coefficient (R) of 0.236 and weighted average of 6.8%, a difference of 3.5%.
Single Mother Households Correlation Summary
| Measurement | Immigrants from Uganda | Shoshone |
| Minimum | 1.1% | 1.1% |
| Maximum | 13.9% | 13.5% |
| Range | 12.8% | 12.4% |
| Mean | 6.0% | 6.6% |
| Median | 6.2% | 5.6% |
| Interquartile 25% (IQ1) | 3.6% | 5.0% |
| Interquartile 75% (IQ3) | 7.2% | 7.6% |
| Interquartile Range (IQR) | 3.6% | 2.6% |
| Standard Deviation (Sample) | 3.1% | 3.3% |
| Standard Deviation (Population) | 3.0% | 3.2% |
Similar Demographics by Single Mother Households
Demographics Similar to Immigrants from Uganda by Single Mother Households
In terms of single mother households, the demographic groups most similar to Immigrants from Uganda are Colombian (6.6%, a difference of 0.010%), South American (6.6%, a difference of 0.050%), Uruguayan (6.6%, a difference of 0.050%), American (6.6%, a difference of 0.12%), and Moroccan (6.6%, a difference of 0.15%).
| Demographics | Rating | Rank | Single Mother Households |
| Immigrants | Afghanistan | 24.7 /100 | #187 | Fair 6.5% |
| Ottawa | 23.8 /100 | #188 | Fair 6.5% |
| Delaware | 23.3 /100 | #189 | Fair 6.5% |
| Peruvians | 21.6 /100 | #190 | Fair 6.5% |
| Samoans | 21.2 /100 | #191 | Fair 6.5% |
| Americans | 19.0 /100 | #192 | Poor 6.6% |
| Colombians | 18.3 /100 | #193 | Poor 6.6% |
| Immigrants | Uganda | 18.3 /100 | #194 | Poor 6.6% |
| South Americans | 18.0 /100 | #195 | Poor 6.6% |
| Uruguayans | 18.0 /100 | #196 | Poor 6.6% |
| Moroccans | 17.4 /100 | #197 | Poor 6.6% |
| Hawaiians | 16.1 /100 | #198 | Poor 6.6% |
| Potawatomi | 15.5 /100 | #199 | Poor 6.6% |
| Immigrants | Ethiopia | 14.7 /100 | #200 | Poor 6.6% |
| Venezuelans | 12.9 /100 | #201 | Poor 6.6% |
Demographics Similar to Shoshone by Single Mother Households
In terms of single mother households, the demographic groups most similar to Shoshone are Cherokee (6.8%, a difference of 0.29%), Aleut (6.8%, a difference of 0.44%), Immigrants from Eastern Africa (6.8%, a difference of 0.65%), Immigrants (6.8%, a difference of 0.74%), and Immigrants from Uruguay (6.7%, a difference of 0.91%).
| Demographics | Rating | Rank | Single Mother Households |
| Vietnamese | 11.3 /100 | #208 | Poor 6.7% |
| Immigrants | Colombia | 10.5 /100 | #209 | Poor 6.7% |
| Immigrants | Nonimmigrants | 10.4 /100 | #210 | Poor 6.7% |
| Immigrants | Venezuela | 8.5 /100 | #211 | Tragic 6.7% |
| Immigrants | Eritrea | 8.4 /100 | #212 | Tragic 6.7% |
| Immigrants | Costa Rica | 8.2 /100 | #213 | Tragic 6.7% |
| Immigrants | Uruguay | 7.9 /100 | #214 | Tragic 6.7% |
| Shoshone | 5.7 /100 | #215 | Tragic 6.8% |
| Cherokee | 5.1 /100 | #216 | Tragic 6.8% |
| Aleuts | 4.8 /100 | #217 | Tragic 6.8% |
| Immigrants | Eastern Africa | 4.4 /100 | #218 | Tragic 6.8% |
| Immigrants | Immigrants | 4.3 /100 | #219 | Tragic 6.8% |
| Immigrants | Thailand | 4.0 /100 | #220 | Tragic 6.9% |
| French American Indians | 3.7 /100 | #221 | Tragic 6.9% |
| Immigrants | Bangladesh | 3.7 /100 | #222 | Tragic 6.9% |