Immigrants from Uganda vs Palestinian Currently Married
COMPARE
Immigrants from Uganda
Palestinian
Currently Married
Currently Married Comparison
Immigrants from Uganda
Palestinians
45.0%
CURRENTLY MARRIED
2.2/ 100
METRIC RATING
224th/ 347
METRIC RANK
47.6%
CURRENTLY MARRIED
90.4/ 100
METRIC RATING
116th/ 347
METRIC RANK
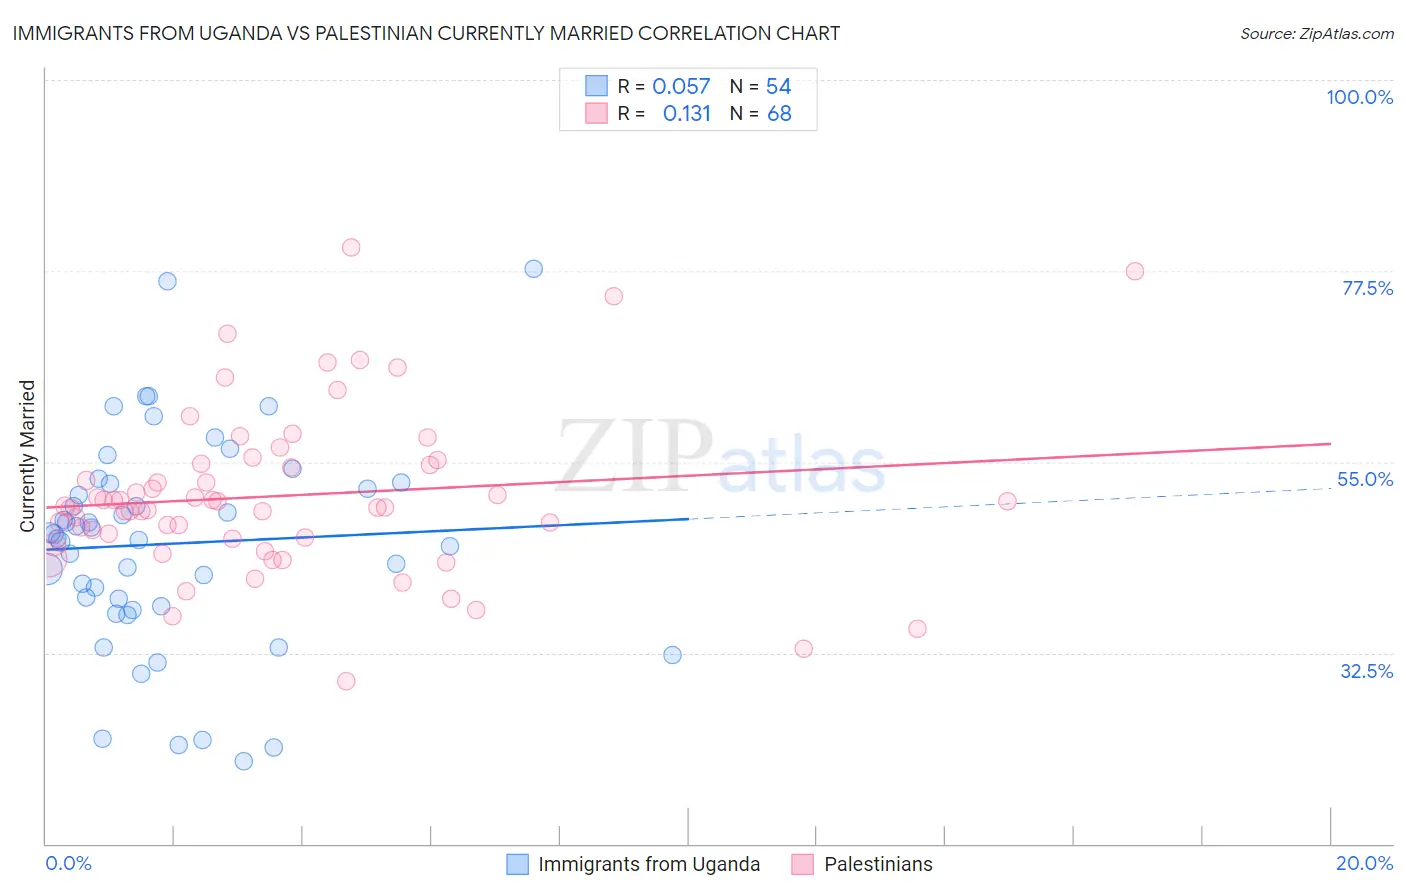
Immigrants from Uganda vs Palestinian Currently Married Correlation Chart
The statistical analysis conducted on geographies consisting of 125,979,600 people shows a slight positive correlation between the proportion of Immigrants from Uganda and percentage of population currently married in the United States with a correlation coefficient (R) of 0.057 and weighted average of 45.0%. Similarly, the statistical analysis conducted on geographies consisting of 216,437,079 people shows a poor positive correlation between the proportion of Palestinians and percentage of population currently married in the United States with a correlation coefficient (R) of 0.131 and weighted average of 47.6%, a difference of 5.7%.
Currently Married Correlation Summary
| Measurement | Immigrants from Uganda | Palestinian |
| Minimum | 19.7% | 29.1% |
| Maximum | 77.7% | 80.2% |
| Range | 58.0% | 51.1% |
| Mean | 45.4% | 51.0% |
| Median | 46.2% | 49.7% |
| Interquartile 25% (IQ1) | 38.0% | 46.0% |
| Interquartile 75% (IQ3) | 52.4% | 54.7% |
| Interquartile Range (IQR) | 14.5% | 8.7% |
| Standard Deviation (Sample) | 12.5% | 9.7% |
| Standard Deviation (Population) | 12.4% | 9.7% |
Similar Demographics by Currently Married
Demographics Similar to Immigrants from Uganda by Currently Married
In terms of currently married, the demographic groups most similar to Immigrants from Uganda are French American Indian (45.0%, a difference of 0.0%), Immigrants from Laos (45.0%, a difference of 0.050%), Comanche (45.0%, a difference of 0.050%), Spanish American (45.0%, a difference of 0.060%), and Immigrants from Uruguay (45.0%, a difference of 0.060%).
| Demographics | Rating | Rank | Currently Married |
| Immigrants | Thailand | 5.1 /100 | #217 | Tragic 45.4% |
| Panamanians | 4.0 /100 | #218 | Tragic 45.3% |
| Immigrants | Portugal | 3.5 /100 | #219 | Tragic 45.2% |
| Kenyans | 3.1 /100 | #220 | Tragic 45.2% |
| Mexicans | 3.0 /100 | #221 | Tragic 45.2% |
| Immigrants | Azores | 2.5 /100 | #222 | Tragic 45.1% |
| Immigrants | Laos | 2.3 /100 | #223 | Tragic 45.0% |
| Immigrants | Uganda | 2.2 /100 | #224 | Tragic 45.0% |
| French American Indians | 2.2 /100 | #225 | Tragic 45.0% |
| Comanche | 2.1 /100 | #226 | Tragic 45.0% |
| Spanish Americans | 2.1 /100 | #227 | Tragic 45.0% |
| Immigrants | Uruguay | 2.0 /100 | #228 | Tragic 45.0% |
| Cree | 1.7 /100 | #229 | Tragic 44.9% |
| Immigrants | Kenya | 1.6 /100 | #230 | Tragic 44.9% |
| Immigrants | Panama | 1.5 /100 | #231 | Tragic 44.9% |
Demographics Similar to Palestinians by Currently Married
In terms of currently married, the demographic groups most similar to Palestinians are South African (47.6%, a difference of 0.010%), Immigrants from Indonesia (47.6%, a difference of 0.010%), Puget Sound Salish (47.6%, a difference of 0.020%), Immigrants from Philippines (47.6%, a difference of 0.020%), and Australian (47.6%, a difference of 0.020%).
| Demographics | Rating | Rank | Currently Married |
| Immigrants | Egypt | 92.3 /100 | #109 | Exceptional 47.7% |
| Immigrants | Russia | 92.0 /100 | #110 | Exceptional 47.7% |
| Immigrants | Hungary | 91.2 /100 | #111 | Exceptional 47.6% |
| Immigrants | Western Europe | 91.1 /100 | #112 | Exceptional 47.6% |
| Immigrants | Denmark | 90.9 /100 | #113 | Exceptional 47.6% |
| South Africans | 90.5 /100 | #114 | Exceptional 47.6% |
| Immigrants | Indonesia | 90.5 /100 | #115 | Exceptional 47.6% |
| Palestinians | 90.4 /100 | #116 | Exceptional 47.6% |
| Puget Sound Salish | 90.3 /100 | #117 | Exceptional 47.6% |
| Immigrants | Philippines | 90.2 /100 | #118 | Exceptional 47.6% |
| Australians | 90.2 /100 | #119 | Exceptional 47.6% |
| Syrians | 88.9 /100 | #120 | Excellent 47.5% |
| Immigrants | Croatia | 88.6 /100 | #121 | Excellent 47.5% |
| Osage | 87.9 /100 | #122 | Excellent 47.5% |
| Immigrants | Kazakhstan | 87.2 /100 | #123 | Excellent 47.4% |