Immigrants from Uganda vs Immigrants from Asia Family Households with Children
COMPARE
Immigrants from Uganda
Immigrants from Asia
Family Households with Children
Family Households with Children Comparison
Immigrants from Uganda
Immigrants from Asia
28.0%
FAMILY HOUSEHOLDS WITH CHILDREN
97.7/ 100
METRIC RATING
107th/ 347
METRIC RANK
28.8%
FAMILY HOUSEHOLDS WITH CHILDREN
100.0/ 100
METRIC RATING
55th/ 347
METRIC RANK
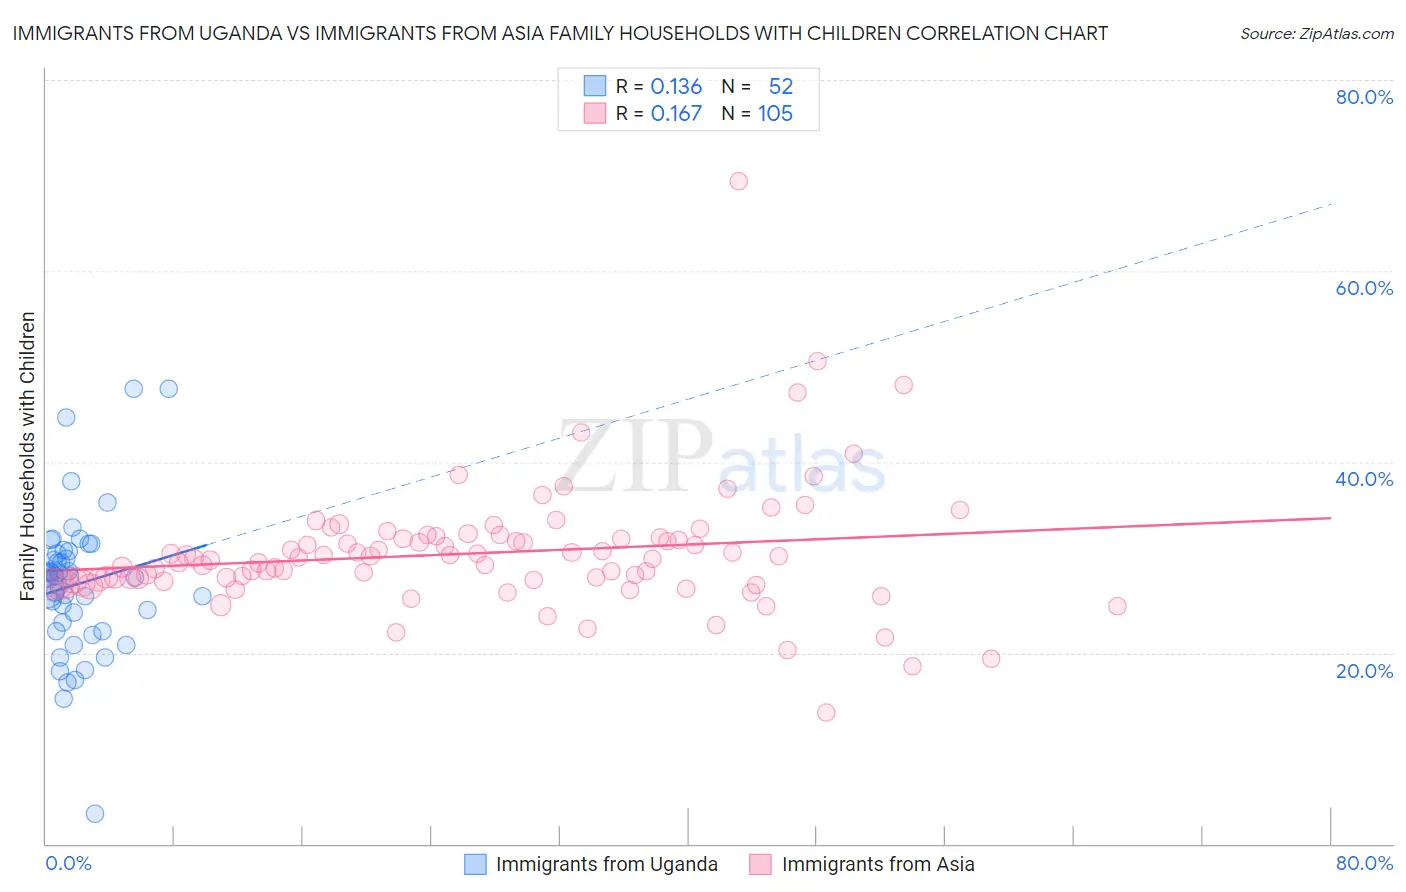
Immigrants from Uganda vs Immigrants from Asia Family Households with Children Correlation Chart
The statistical analysis conducted on geographies consisting of 125,961,015 people shows a poor positive correlation between the proportion of Immigrants from Uganda and percentage of family households with children in the United States with a correlation coefficient (R) of 0.136 and weighted average of 28.0%. Similarly, the statistical analysis conducted on geographies consisting of 548,215,399 people shows a poor positive correlation between the proportion of Immigrants from Asia and percentage of family households with children in the United States with a correlation coefficient (R) of 0.167 and weighted average of 28.8%, a difference of 2.9%.
Family Households with Children Correlation Summary
| Measurement | Immigrants from Uganda | Immigrants from Asia |
| Minimum | 3.2% | 13.7% |
| Maximum | 47.7% | 69.4% |
| Range | 44.5% | 55.7% |
| Mean | 27.2% | 30.4% |
| Median | 28.0% | 29.9% |
| Interquartile 25% (IQ1) | 22.7% | 27.6% |
| Interquartile 75% (IQ3) | 30.5% | 32.0% |
| Interquartile Range (IQR) | 7.8% | 4.5% |
| Standard Deviation (Sample) | 7.6% | 6.6% |
| Standard Deviation (Population) | 7.5% | 6.6% |
Similar Demographics by Family Households with Children
Demographics Similar to Immigrants from Uganda by Family Households with Children
In terms of family households with children, the demographic groups most similar to Immigrants from Uganda are Immigrants from Burma/Myanmar (28.0%, a difference of 0.010%), Tohono O'odham (28.0%, a difference of 0.020%), Immigrants from South America (28.0%, a difference of 0.060%), Spaniard (28.0%, a difference of 0.060%), and Scandinavian (28.0%, a difference of 0.12%).
| Demographics | Rating | Rank | Family Households with Children |
| Indonesians | 98.8 /100 | #100 | Exceptional 28.1% |
| Immigrants | Oceania | 98.8 /100 | #101 | Exceptional 28.1% |
| Assyrians/Chaldeans/Syriacs | 98.7 /100 | #102 | Exceptional 28.1% |
| Palestinians | 98.5 /100 | #103 | Exceptional 28.1% |
| Sioux | 98.3 /100 | #104 | Exceptional 28.1% |
| Choctaw | 98.3 /100 | #105 | Exceptional 28.1% |
| Immigrants | South America | 98.0 /100 | #106 | Exceptional 28.0% |
| Immigrants | Uganda | 97.7 /100 | #107 | Exceptional 28.0% |
| Immigrants | Burma/Myanmar | 97.7 /100 | #108 | Exceptional 28.0% |
| Tohono O'odham | 97.6 /100 | #109 | Exceptional 28.0% |
| Spaniards | 97.4 /100 | #110 | Exceptional 28.0% |
| Scandinavians | 97.1 /100 | #111 | Exceptional 28.0% |
| Immigrants | Middle Africa | 97.0 /100 | #112 | Exceptional 28.0% |
| Arabs | 97.0 /100 | #113 | Exceptional 28.0% |
| South American Indians | 96.9 /100 | #114 | Exceptional 28.0% |
Demographics Similar to Immigrants from Asia by Family Households with Children
In terms of family households with children, the demographic groups most similar to Immigrants from Asia are Sierra Leonean (28.9%, a difference of 0.060%), Immigrants from Guatemala (28.8%, a difference of 0.070%), Immigrants from Cambodia (28.9%, a difference of 0.14%), Guatemalan (28.9%, a difference of 0.21%), and Immigrants from Peru (28.9%, a difference of 0.29%).
| Demographics | Rating | Rank | Family Households with Children |
| Apache | 100.0 /100 | #48 | Exceptional 29.0% |
| Jordanians | 100.0 /100 | #49 | Exceptional 29.0% |
| Immigrants | Immigrants | 100.0 /100 | #50 | Exceptional 28.9% |
| Immigrants | Peru | 100.0 /100 | #51 | Exceptional 28.9% |
| Guatemalans | 100.0 /100 | #52 | Exceptional 28.9% |
| Immigrants | Cambodia | 100.0 /100 | #53 | Exceptional 28.9% |
| Sierra Leoneans | 100.0 /100 | #54 | Exceptional 28.9% |
| Immigrants | Asia | 100.0 /100 | #55 | Exceptional 28.8% |
| Immigrants | Guatemala | 100.0 /100 | #56 | Exceptional 28.8% |
| Danes | 100.0 /100 | #57 | Exceptional 28.7% |
| Hawaiians | 100.0 /100 | #58 | Exceptional 28.7% |
| Immigrants | Nigeria | 100.0 /100 | #59 | Exceptional 28.6% |
| Hmong | 99.9 /100 | #60 | Exceptional 28.6% |
| Immigrants | Ghana | 99.9 /100 | #61 | Exceptional 28.6% |
| Egyptians | 99.9 /100 | #62 | Exceptional 28.6% |