Immigrants from Trinidad and Tobago vs Mexican Single Mother Households
COMPARE
Immigrants from Trinidad and Tobago
Mexican
Single Mother Households
Single Mother Households Comparison
Immigrants from Trinidad and Tobago
Mexicans
7.6%
SINGLE MOTHER HOUSEHOLDS
0.1/ 100
METRIC RATING
277th/ 347
METRIC RANK
8.0%
SINGLE MOTHER HOUSEHOLDS
0.0/ 100
METRIC RATING
300th/ 347
METRIC RANK
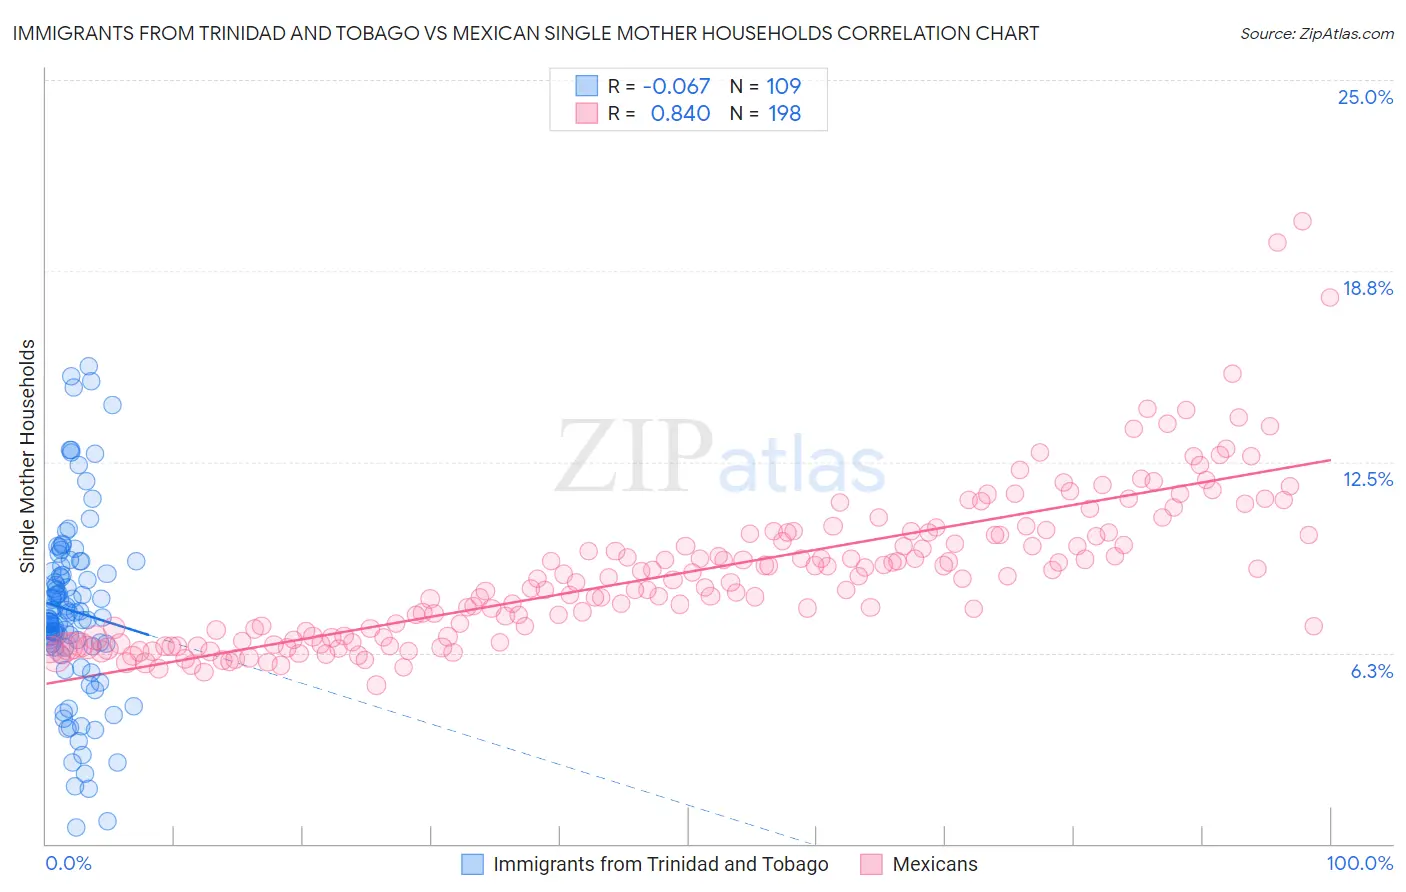
Immigrants from Trinidad and Tobago vs Mexican Single Mother Households Correlation Chart
The statistical analysis conducted on geographies consisting of 223,270,530 people shows a slight negative correlation between the proportion of Immigrants from Trinidad and Tobago and percentage of single mother households in the United States with a correlation coefficient (R) of -0.067 and weighted average of 7.6%. Similarly, the statistical analysis conducted on geographies consisting of 560,737,784 people shows a very strong positive correlation between the proportion of Mexicans and percentage of single mother households in the United States with a correlation coefficient (R) of 0.840 and weighted average of 8.0%, a difference of 4.7%.
Single Mother Households Correlation Summary
| Measurement | Immigrants from Trinidad and Tobago | Mexican |
| Minimum | 0.52% | 5.2% |
| Maximum | 15.6% | 20.4% |
| Range | 15.1% | 15.2% |
| Mean | 7.6% | 8.9% |
| Median | 7.4% | 8.7% |
| Interquartile 25% (IQ1) | 6.5% | 6.8% |
| Interquartile 75% (IQ3) | 9.0% | 10.1% |
| Interquartile Range (IQR) | 2.5% | 3.4% |
| Standard Deviation (Sample) | 3.0% | 2.5% |
| Standard Deviation (Population) | 3.0% | 2.5% |
Similar Demographics by Single Mother Households
Demographics Similar to Immigrants from Trinidad and Tobago by Single Mother Households
In terms of single mother households, the demographic groups most similar to Immigrants from Trinidad and Tobago are Central American (7.6%, a difference of 0.0%), Guyanese (7.6%, a difference of 0.040%), Immigrants from El Salvador (7.6%, a difference of 0.23%), Central American Indian (7.6%, a difference of 0.49%), and Immigrants from Guyana (7.6%, a difference of 0.59%).
| Demographics | Rating | Rank | Single Mother Households |
| Immigrants | Cuba | 0.1 /100 | #270 | Tragic 7.5% |
| Salvadorans | 0.1 /100 | #271 | Tragic 7.5% |
| Immigrants | Azores | 0.1 /100 | #272 | Tragic 7.5% |
| Belizeans | 0.1 /100 | #273 | Tragic 7.6% |
| Immigrants | Guyana | 0.1 /100 | #274 | Tragic 7.6% |
| Central American Indians | 0.1 /100 | #275 | Tragic 7.6% |
| Guyanese | 0.1 /100 | #276 | Tragic 7.6% |
| Immigrants | Trinidad and Tobago | 0.1 /100 | #277 | Tragic 7.6% |
| Central Americans | 0.1 /100 | #278 | Tragic 7.6% |
| Immigrants | El Salvador | 0.0 /100 | #279 | Tragic 7.6% |
| Immigrants | Sierra Leone | 0.0 /100 | #280 | Tragic 7.7% |
| Immigrants | Laos | 0.0 /100 | #281 | Tragic 7.7% |
| Guatemalans | 0.0 /100 | #282 | Tragic 7.7% |
| Nigerians | 0.0 /100 | #283 | Tragic 7.7% |
| Immigrants | Belize | 0.0 /100 | #284 | Tragic 7.7% |
Demographics Similar to Mexicans by Single Mother Households
In terms of single mother households, the demographic groups most similar to Mexicans are Chippewa (8.0%, a difference of 0.16%), Immigrants from Ghana (8.0%, a difference of 0.25%), Immigrants from Bahamas (8.0%, a difference of 0.27%), Houma (7.9%, a difference of 0.46%), and Immigrants from West Indies (7.9%, a difference of 0.54%).
| Demographics | Rating | Rank | Single Mother Households |
| Immigrants | Cameroon | 0.0 /100 | #293 | Tragic 7.9% |
| Apache | 0.0 /100 | #294 | Tragic 7.9% |
| Barbadians | 0.0 /100 | #295 | Tragic 7.9% |
| Immigrants | Latin America | 0.0 /100 | #296 | Tragic 7.9% |
| Hispanics or Latinos | 0.0 /100 | #297 | Tragic 7.9% |
| Immigrants | West Indies | 0.0 /100 | #298 | Tragic 7.9% |
| Houma | 0.0 /100 | #299 | Tragic 7.9% |
| Mexicans | 0.0 /100 | #300 | Tragic 8.0% |
| Chippewa | 0.0 /100 | #301 | Tragic 8.0% |
| Immigrants | Ghana | 0.0 /100 | #302 | Tragic 8.0% |
| Immigrants | Bahamas | 0.0 /100 | #303 | Tragic 8.0% |
| Natives/Alaskans | 0.0 /100 | #304 | Tragic 8.0% |
| Colville | 0.0 /100 | #305 | Tragic 8.0% |
| Immigrants | Barbados | 0.0 /100 | #306 | Tragic 8.0% |
| Immigrants | St. Vincent and the Grenadines | 0.0 /100 | #307 | Tragic 8.0% |