Immigrants from Trinidad and Tobago vs Immigrants from Dominican Republic Family Households
COMPARE
Immigrants from Trinidad and Tobago
Immigrants from Dominican Republic
Family Households
Family Households Comparison
Immigrants from Trinidad and Tobago
Immigrants from Dominican Republic
64.2%
FAMILY HOUSEHOLDS
34.9/ 100
METRIC RATING
181st/ 347
METRIC RANK
63.3%
FAMILY HOUSEHOLDS
1.0/ 100
METRIC RATING
253rd/ 347
METRIC RANK
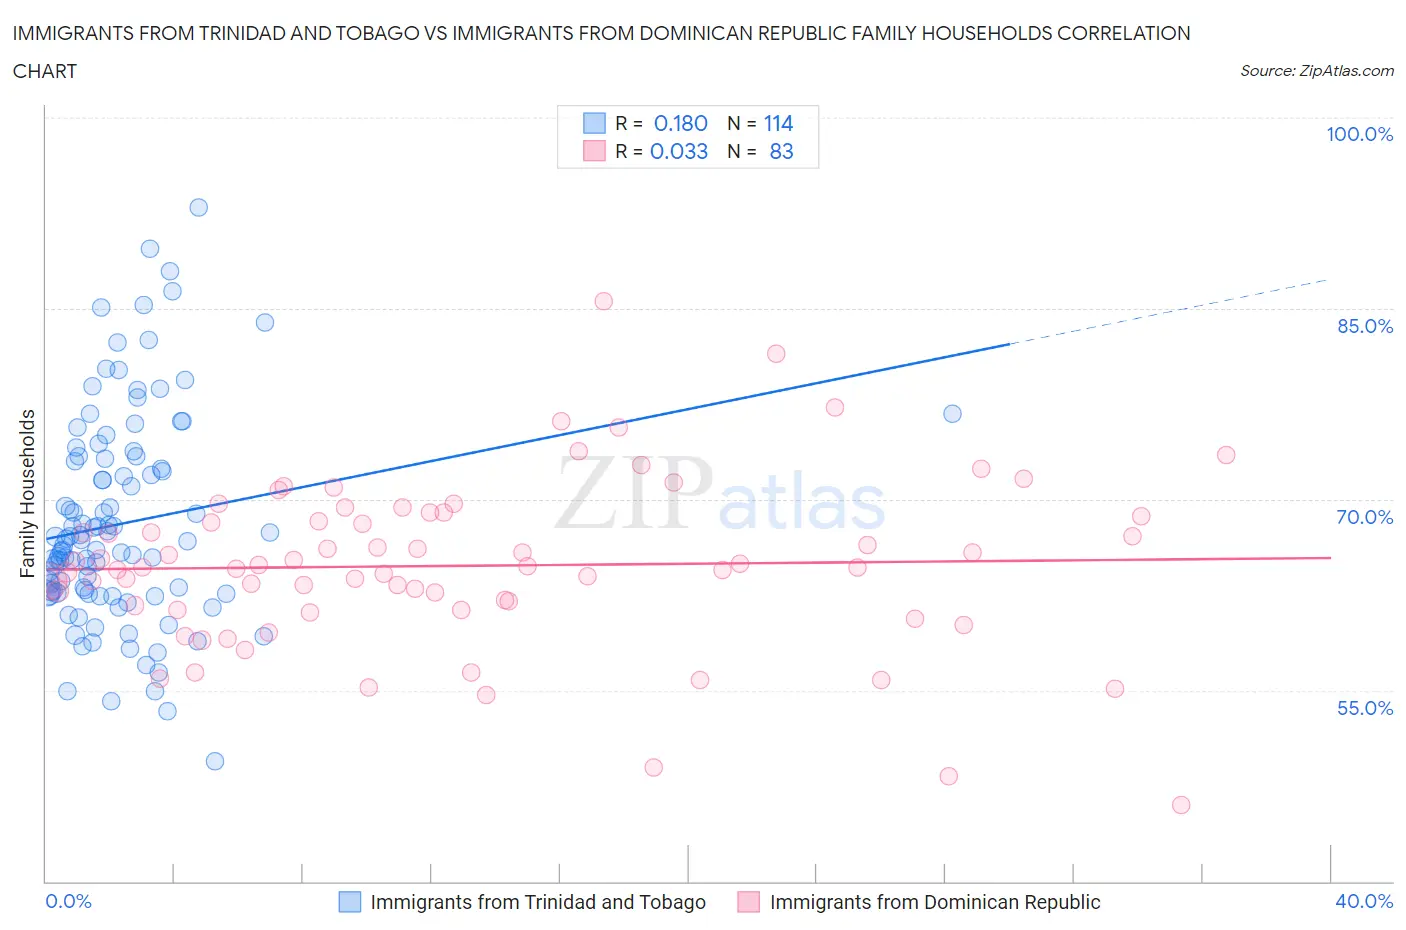
Immigrants from Trinidad and Tobago vs Immigrants from Dominican Republic Family Households Correlation Chart
The statistical analysis conducted on geographies consisting of 223,484,362 people shows a poor positive correlation between the proportion of Immigrants from Trinidad and Tobago and percentage of family households in the United States with a correlation coefficient (R) of 0.180 and weighted average of 64.2%. Similarly, the statistical analysis conducted on geographies consisting of 274,978,425 people shows no correlation between the proportion of Immigrants from Dominican Republic and percentage of family households in the United States with a correlation coefficient (R) of 0.033 and weighted average of 63.3%, a difference of 1.3%.
Family Households Correlation Summary
| Measurement | Immigrants from Trinidad and Tobago | Immigrants from Dominican Republic |
| Minimum | 49.5% | 46.0% |
| Maximum | 92.9% | 85.5% |
| Range | 43.4% | 39.6% |
| Mean | 68.1% | 64.8% |
| Median | 66.5% | 64.7% |
| Interquartile 25% (IQ1) | 62.6% | 61.3% |
| Interquartile 75% (IQ3) | 73.2% | 68.7% |
| Interquartile Range (IQR) | 10.5% | 7.4% |
| Standard Deviation (Sample) | 8.3% | 6.7% |
| Standard Deviation (Population) | 8.2% | 6.6% |
Similar Demographics by Family Households
Demographics Similar to Immigrants from Trinidad and Tobago by Family Households
In terms of family households, the demographic groups most similar to Immigrants from Trinidad and Tobago are Immigrants from Honduras (64.2%, a difference of 0.0%), Ukrainian (64.2%, a difference of 0.0%), Creek (64.2%, a difference of 0.010%), Puerto Rican (64.2%, a difference of 0.020%), and Immigrants from Ukraine (64.2%, a difference of 0.050%).
| Demographics | Rating | Rank | Family Households |
| Immigrants | Germany | 50.0 /100 | #174 | Average 64.3% |
| Bangladeshis | 44.3 /100 | #175 | Average 64.3% |
| Vietnamese | 43.6 /100 | #176 | Average 64.2% |
| Immigrants | Micronesia | 42.3 /100 | #177 | Average 64.2% |
| Jamaicans | 40.6 /100 | #178 | Average 64.2% |
| Immigrants | Ukraine | 38.2 /100 | #179 | Fair 64.2% |
| Immigrants | Honduras | 35.0 /100 | #180 | Fair 64.2% |
| Immigrants | Trinidad and Tobago | 34.9 /100 | #181 | Fair 64.2% |
| Ukrainians | 34.6 /100 | #182 | Fair 64.2% |
| Creek | 34.1 /100 | #183 | Fair 64.2% |
| Puerto Ricans | 33.4 /100 | #184 | Fair 64.2% |
| Immigrants | Iran | 30.4 /100 | #185 | Fair 64.1% |
| Spanish Americans | 30.1 /100 | #186 | Fair 64.1% |
| Northern Europeans | 28.2 /100 | #187 | Fair 64.1% |
| Paraguayans | 26.7 /100 | #188 | Fair 64.1% |
Demographics Similar to Immigrants from Dominican Republic by Family Households
In terms of family households, the demographic groups most similar to Immigrants from Dominican Republic are Slovak (63.3%, a difference of 0.010%), Bahamian (63.3%, a difference of 0.020%), Potawatomi (63.3%, a difference of 0.030%), Taiwanese (63.3%, a difference of 0.040%), and Luxembourger (63.3%, a difference of 0.050%).
| Demographics | Rating | Rank | Family Households |
| Immigrants | Ghana | 1.6 /100 | #246 | Tragic 63.4% |
| Immigrants | Uzbekistan | 1.5 /100 | #247 | Tragic 63.4% |
| Dominicans | 1.5 /100 | #248 | Tragic 63.4% |
| Russians | 1.4 /100 | #249 | Tragic 63.4% |
| Immigrants | Japan | 1.4 /100 | #250 | Tragic 63.4% |
| Taiwanese | 1.2 /100 | #251 | Tragic 63.3% |
| Bahamians | 1.1 /100 | #252 | Tragic 63.3% |
| Immigrants | Dominican Republic | 1.0 /100 | #253 | Tragic 63.3% |
| Slovaks | 1.0 /100 | #254 | Tragic 63.3% |
| Potawatomi | 1.0 /100 | #255 | Tragic 63.3% |
| Luxembourgers | 0.9 /100 | #256 | Tragic 63.3% |
| Icelanders | 0.8 /100 | #257 | Tragic 63.3% |
| Immigrants | Barbados | 0.7 /100 | #258 | Tragic 63.2% |
| Immigrants | Western Europe | 0.6 /100 | #259 | Tragic 63.2% |
| Cypriots | 0.6 /100 | #260 | Tragic 63.2% |