Immigrants from Thailand vs Immigrants from Switzerland Single Father Households
COMPARE
Immigrants from Thailand
Immigrants from Switzerland
Single Father Households
Single Father Households Comparison
Immigrants from Thailand
Immigrants from Switzerland
2.5%
SINGLE FATHER HOUSEHOLDS
1.8/ 100
METRIC RATING
254th/ 347
METRIC RANK
2.0%
SINGLE FATHER HOUSEHOLDS
99.9/ 100
METRIC RATING
50th/ 347
METRIC RANK
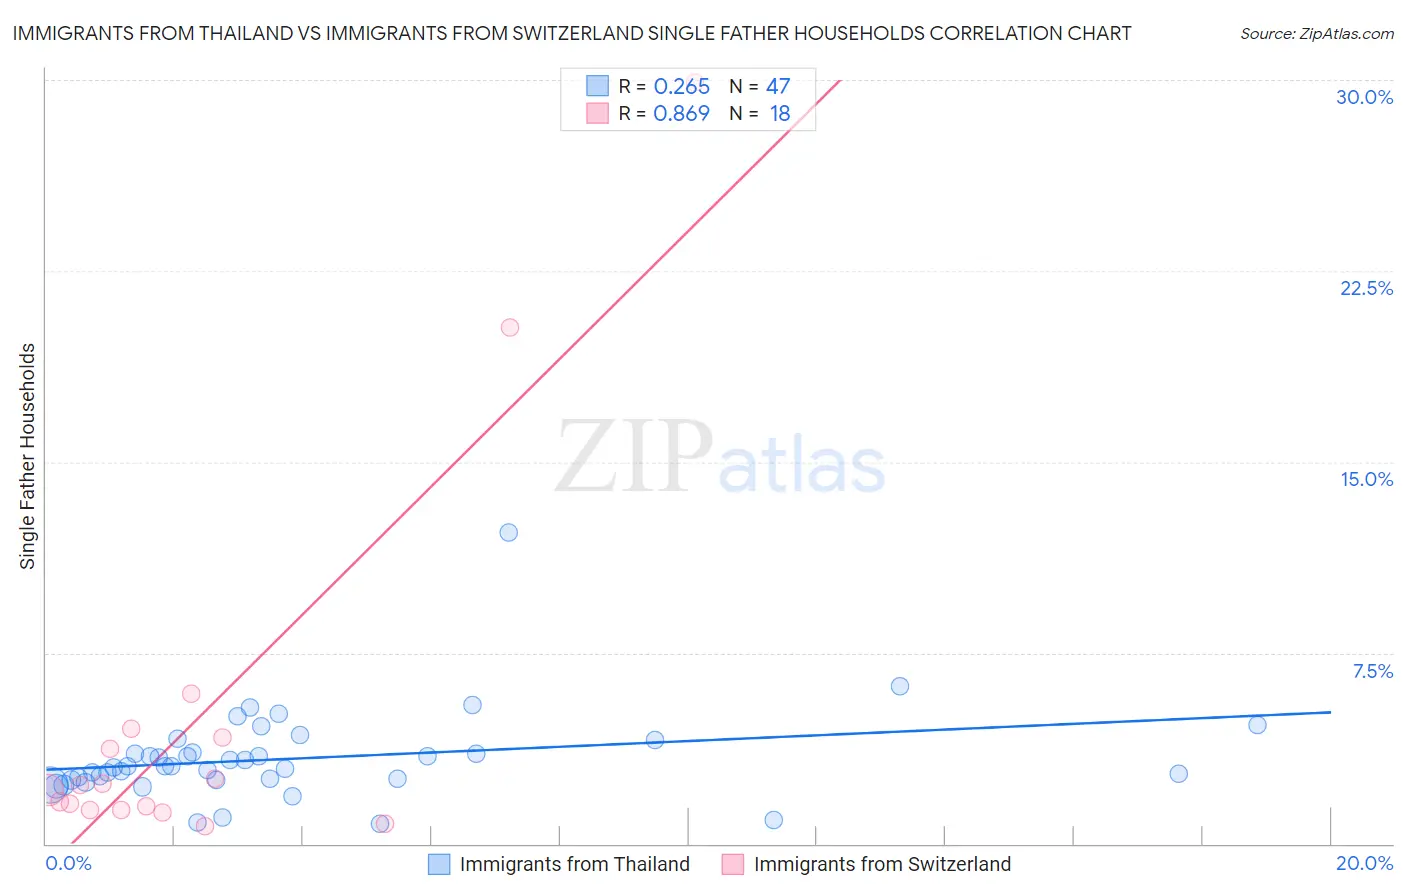
Immigrants from Thailand vs Immigrants from Switzerland Single Father Households Correlation Chart
The statistical analysis conducted on geographies consisting of 315,341,972 people shows a weak positive correlation between the proportion of Immigrants from Thailand and percentage of single father households in the United States with a correlation coefficient (R) of 0.265 and weighted average of 2.5%. Similarly, the statistical analysis conducted on geographies consisting of 147,445,509 people shows a very strong positive correlation between the proportion of Immigrants from Switzerland and percentage of single father households in the United States with a correlation coefficient (R) of 0.869 and weighted average of 2.0%, a difference of 24.4%.
Single Father Households Correlation Summary
| Measurement | Immigrants from Thailand | Immigrants from Switzerland |
| Minimum | 0.78% | 0.69% |
| Maximum | 12.2% | 29.9% |
| Range | 11.5% | 29.2% |
| Mean | 3.3% | 4.9% |
| Median | 3.0% | 2.2% |
| Interquartile 25% (IQ1) | 2.5% | 1.3% |
| Interquartile 75% (IQ3) | 3.6% | 4.2% |
| Interquartile Range (IQR) | 1.1% | 2.8% |
| Standard Deviation (Sample) | 1.8% | 7.7% |
| Standard Deviation (Population) | 1.8% | 7.4% |
Similar Demographics by Single Father Households
Demographics Similar to Immigrants from Thailand by Single Father Households
In terms of single father households, the demographic groups most similar to Immigrants from Thailand are Immigrants from Somalia (2.5%, a difference of 0.040%), Immigrants from Eritrea (2.5%, a difference of 0.10%), Liberian (2.5%, a difference of 0.13%), Somali (2.5%, a difference of 0.22%), and Immigrants from Cameroon (2.5%, a difference of 0.39%).
| Demographics | Rating | Rank | Single Father Households |
| Delaware | 2.5 /100 | #247 | Tragic 2.5% |
| Bahamians | 2.4 /100 | #248 | Tragic 2.5% |
| Immigrants | Cameroon | 2.3 /100 | #249 | Tragic 2.5% |
| Somalis | 2.1 /100 | #250 | Tragic 2.5% |
| Liberians | 2.0 /100 | #251 | Tragic 2.5% |
| Immigrants | Eritrea | 2.0 /100 | #252 | Tragic 2.5% |
| Immigrants | Somalia | 1.9 /100 | #253 | Tragic 2.5% |
| Immigrants | Thailand | 1.8 /100 | #254 | Tragic 2.5% |
| Tongans | 1.5 /100 | #255 | Tragic 2.5% |
| Potawatomi | 1.4 /100 | #256 | Tragic 2.5% |
| Immigrants | Congo | 1.2 /100 | #257 | Tragic 2.5% |
| Spanish | 1.1 /100 | #258 | Tragic 2.5% |
| Comanche | 1.0 /100 | #259 | Tragic 2.5% |
| Immigrants | Caribbean | 1.0 /100 | #260 | Tragic 2.5% |
| Immigrants | Belize | 0.9 /100 | #261 | Tragic 2.5% |
Demographics Similar to Immigrants from Switzerland by Single Father Households
In terms of single father households, the demographic groups most similar to Immigrants from Switzerland are Immigrants from Serbia (2.0%, a difference of 0.0%), Immigrants from Poland (2.0%, a difference of 0.0%), Immigrants from Kazakhstan (2.0%, a difference of 0.020%), Immigrants from Ukraine (2.0%, a difference of 0.040%), and Immigrants from Europe (2.0%, a difference of 0.24%).
| Demographics | Rating | Rank | Single Father Households |
| Immigrants | Grenada | 100.0 /100 | #43 | Exceptional 2.0% |
| Latvians | 100.0 /100 | #44 | Exceptional 2.0% |
| Russians | 100.0 /100 | #45 | Exceptional 2.0% |
| Immigrants | Lebanon | 100.0 /100 | #46 | Exceptional 2.0% |
| Immigrants | Ukraine | 99.9 /100 | #47 | Exceptional 2.0% |
| Immigrants | Kazakhstan | 99.9 /100 | #48 | Exceptional 2.0% |
| Immigrants | Serbia | 99.9 /100 | #49 | Exceptional 2.0% |
| Immigrants | Switzerland | 99.9 /100 | #50 | Exceptional 2.0% |
| Immigrants | Poland | 99.9 /100 | #51 | Exceptional 2.0% |
| Immigrants | Europe | 99.9 /100 | #52 | Exceptional 2.0% |
| Immigrants | Northern Europe | 99.9 /100 | #53 | Exceptional 2.0% |
| Immigrants | Korea | 99.9 /100 | #54 | Exceptional 2.0% |
| Immigrants | France | 99.9 /100 | #55 | Exceptional 2.0% |
| Immigrants | Norway | 99.9 /100 | #56 | Exceptional 2.0% |
| Burmese | 99.9 /100 | #57 | Exceptional 2.0% |