Immigrants from Sudan vs Yup'ik Single Mother Households
COMPARE
Immigrants from Sudan
Yup'ik
Single Mother Households
Single Mother Households Comparison
Immigrants from Sudan
Yup'ik
6.9%
SINGLE MOTHER HOUSEHOLDS
3.5/ 100
METRIC RATING
224th/ 347
METRIC RANK
10.0%
SINGLE MOTHER HOUSEHOLDS
0.0/ 100
METRIC RATING
347th/ 347
METRIC RANK
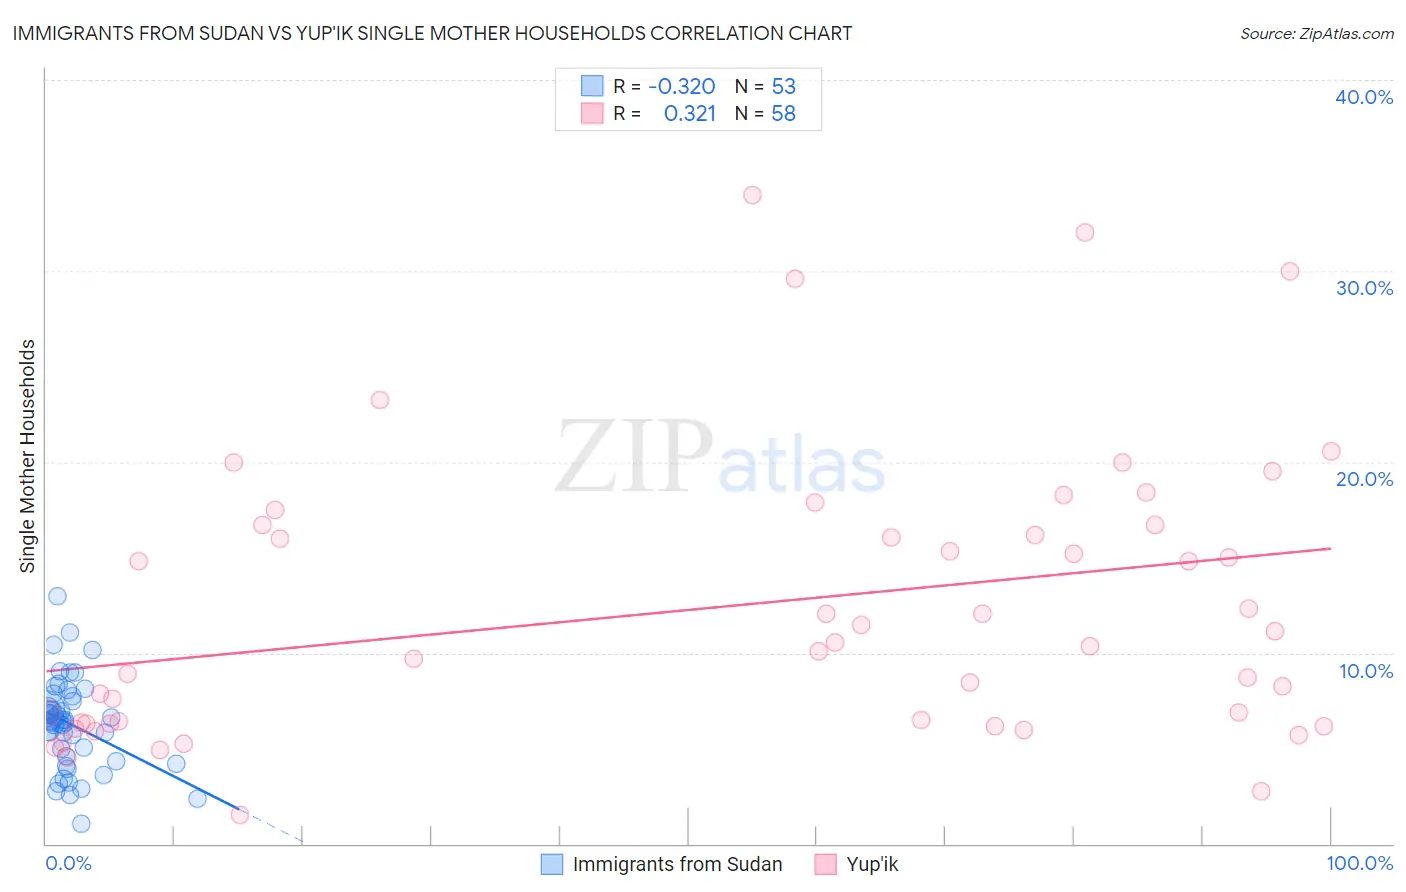
Immigrants from Sudan vs Yup'ik Single Mother Households Correlation Chart
The statistical analysis conducted on geographies consisting of 118,904,005 people shows a mild negative correlation between the proportion of Immigrants from Sudan and percentage of single mother households in the United States with a correlation coefficient (R) of -0.320 and weighted average of 6.9%. Similarly, the statistical analysis conducted on geographies consisting of 39,868,433 people shows a mild positive correlation between the proportion of Yup'ik and percentage of single mother households in the United States with a correlation coefficient (R) of 0.321 and weighted average of 10.0%, a difference of 45.3%.
Single Mother Households Correlation Summary
| Measurement | Immigrants from Sudan | Yup'ik |
| Minimum | 1.0% | 1.5% |
| Maximum | 13.0% | 34.0% |
| Range | 11.9% | 32.5% |
| Mean | 6.3% | 12.4% |
| Median | 6.5% | 10.4% |
| Interquartile 25% (IQ1) | 4.5% | 6.3% |
| Interquartile 75% (IQ3) | 7.6% | 16.7% |
| Interquartile Range (IQR) | 3.1% | 10.4% |
| Standard Deviation (Sample) | 2.4% | 7.4% |
| Standard Deviation (Population) | 2.3% | 7.4% |
Similar Demographics by Single Mother Households
Demographics Similar to Immigrants from Sudan by Single Mother Households
In terms of single mother households, the demographic groups most similar to Immigrants from Sudan are Immigrants from Micronesia (6.9%, a difference of 0.12%), Immigrants from Bangladesh (6.9%, a difference of 0.17%), French American Indian (6.9%, a difference of 0.19%), Sudanese (6.9%, a difference of 0.27%), and Immigrants from Thailand (6.9%, a difference of 0.39%).
| Demographics | Rating | Rank | Single Mother Households |
| Aleuts | 4.8 /100 | #217 | Tragic 6.8% |
| Immigrants | Eastern Africa | 4.4 /100 | #218 | Tragic 6.8% |
| Immigrants | Immigrants | 4.3 /100 | #219 | Tragic 6.8% |
| Immigrants | Thailand | 4.0 /100 | #220 | Tragic 6.9% |
| French American Indians | 3.7 /100 | #221 | Tragic 6.9% |
| Immigrants | Bangladesh | 3.7 /100 | #222 | Tragic 6.9% |
| Immigrants | Micronesia | 3.6 /100 | #223 | Tragic 6.9% |
| Immigrants | Sudan | 3.5 /100 | #224 | Tragic 6.9% |
| Sudanese | 3.1 /100 | #225 | Tragic 6.9% |
| Paiute | 2.4 /100 | #226 | Tragic 7.0% |
| Kenyans | 2.3 /100 | #227 | Tragic 7.0% |
| Iroquois | 2.2 /100 | #228 | Tragic 7.0% |
| Immigrants | Kenya | 2.1 /100 | #229 | Tragic 7.0% |
| Creek | 1.6 /100 | #230 | Tragic 7.0% |
| Spanish Americans | 1.6 /100 | #231 | Tragic 7.0% |
Demographics Similar to Yup'ik by Single Mother Households
In terms of single mother households, the demographic groups most similar to Yup'ik are Yuman (9.6%, a difference of 3.8%), Immigrants from Cabo Verde (9.6%, a difference of 4.4%), Immigrants from Dominican Republic (9.5%, a difference of 5.2%), Dominican (9.2%, a difference of 8.9%), and Menominee (9.2%, a difference of 9.2%).
| Demographics | Rating | Rank | Single Mother Households |
| Liberians | 0.0 /100 | #333 | Tragic 8.6% |
| Immigrants | Liberia | 0.0 /100 | #334 | Tragic 8.7% |
| Immigrants | Dominica | 0.0 /100 | #335 | Tragic 8.7% |
| Puerto Ricans | 0.0 /100 | #336 | Tragic 8.7% |
| Navajo | 0.0 /100 | #337 | Tragic 8.8% |
| Cape Verdeans | 0.0 /100 | #338 | Tragic 8.9% |
| Blacks/African Americans | 0.0 /100 | #339 | Tragic 9.0% |
| Lumbee | 0.0 /100 | #340 | Tragic 9.1% |
| Tohono O'odham | 0.0 /100 | #341 | Tragic 9.1% |
| Menominee | 0.0 /100 | #342 | Tragic 9.2% |
| Dominicans | 0.0 /100 | #343 | Tragic 9.2% |
| Immigrants | Dominican Republic | 0.0 /100 | #344 | Tragic 9.5% |
| Immigrants | Cabo Verde | 0.0 /100 | #345 | Tragic 9.6% |
| Yuman | 0.0 /100 | #346 | Tragic 9.6% |
| Yup'ik | 0.0 /100 | #347 | Tragic 10.0% |