Immigrants from St. Vincent and the Grenadines vs Estonian Divorced or Separated
COMPARE
Immigrants from St. Vincent and the Grenadines
Estonian
Divorced or Separated
Divorced or Separated Comparison
Immigrants from St. Vincent and the Grenadines
Estonians
11.8%
DIVORCED OR SEPARATED
88.4/ 100
METRIC RATING
129th/ 347
METRIC RANK
11.7%
DIVORCED OR SEPARATED
96.6/ 100
METRIC RATING
113th/ 347
METRIC RANK
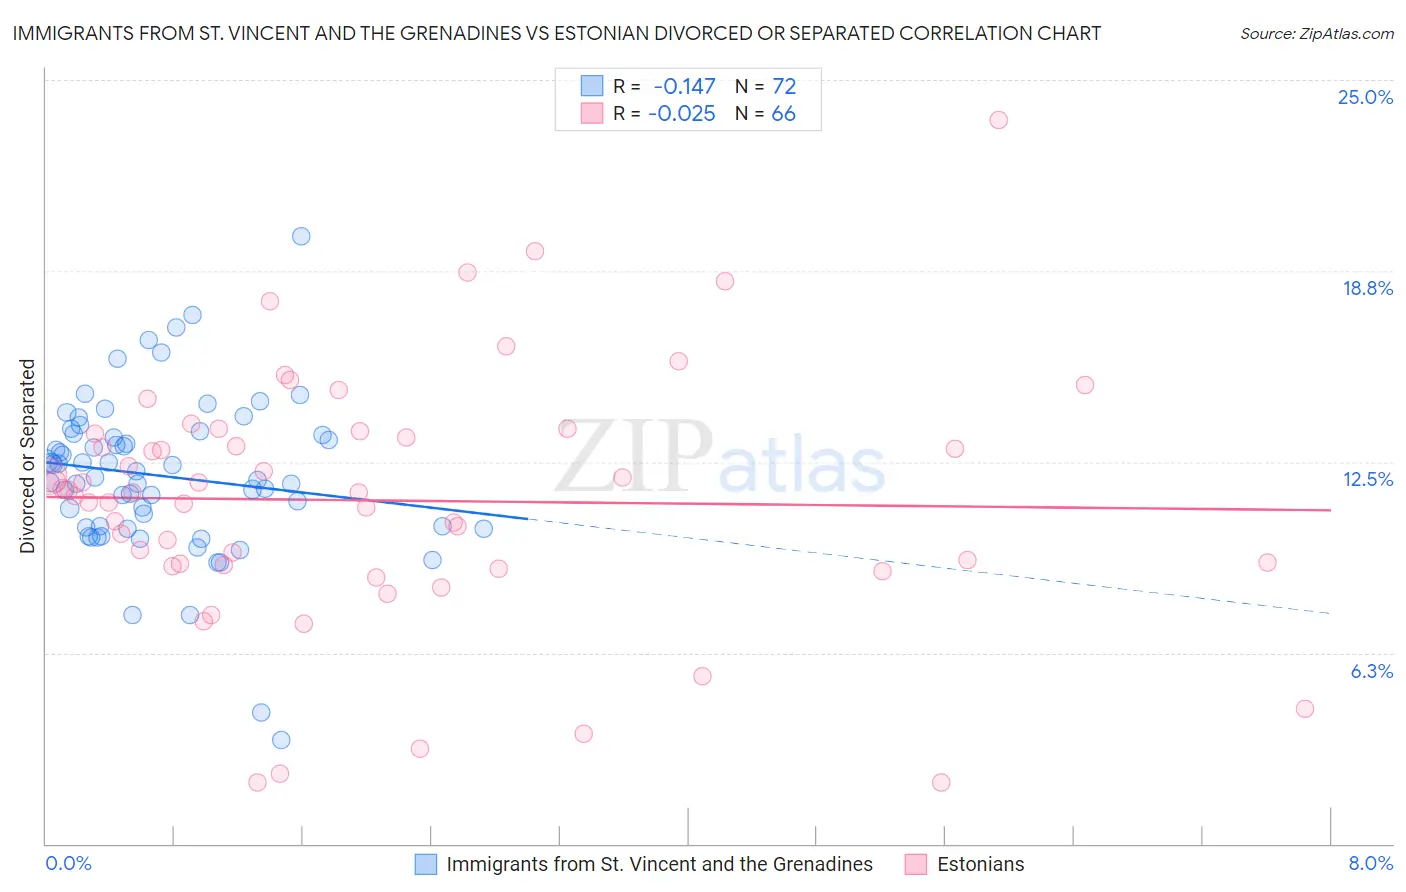
Immigrants from St. Vincent and the Grenadines vs Estonian Divorced or Separated Correlation Chart
The statistical analysis conducted on geographies consisting of 56,190,890 people shows a poor negative correlation between the proportion of Immigrants from St. Vincent and the Grenadines and percentage of population currently divorced or separated in the United States with a correlation coefficient (R) of -0.147 and weighted average of 11.8%. Similarly, the statistical analysis conducted on geographies consisting of 123,504,002 people shows no correlation between the proportion of Estonians and percentage of population currently divorced or separated in the United States with a correlation coefficient (R) of -0.025 and weighted average of 11.7%, a difference of 1.2%.
Divorced or Separated Correlation Summary
| Measurement | Immigrants from St. Vincent and the Grenadines | Estonian |
| Minimum | 3.4% | 2.0% |
| Maximum | 19.9% | 23.7% |
| Range | 16.5% | 21.7% |
| Mean | 12.0% | 11.2% |
| Median | 12.1% | 11.5% |
| Interquartile 25% (IQ1) | 10.4% | 9.1% |
| Interquartile 75% (IQ3) | 13.4% | 13.4% |
| Interquartile Range (IQR) | 3.0% | 4.3% |
| Standard Deviation (Sample) | 2.6% | 4.1% |
| Standard Deviation (Population) | 2.6% | 4.1% |
Demographics Similar to Immigrants from St. Vincent and the Grenadines and Estonians by Divorced or Separated
In terms of divorced or separated, the demographic groups most similar to Immigrants from St. Vincent and the Grenadines are Immigrants from Austria (11.8%, a difference of 0.010%), Immigrants from Cambodia (11.8%, a difference of 0.020%), South African (11.8%, a difference of 0.040%), Immigrants from Ecuador (11.8%, a difference of 0.040%), and South American Indian (11.8%, a difference of 0.38%). Similarly, the demographic groups most similar to Estonians are Immigrants from France (11.7%, a difference of 0.0%), Immigrants from Spain (11.7%, a difference of 0.050%), Immigrants from Norway (11.7%, a difference of 0.17%), Lithuanian (11.7%, a difference of 0.22%), and Immigrants from Iraq (11.7%, a difference of 0.28%).
| Demographics | Rating | Rank | Divorced or Separated |
| Immigrants | Spain | 96.8 /100 | #111 | Exceptional 11.7% |
| Immigrants | France | 96.6 /100 | #112 | Exceptional 11.7% |
| Estonians | 96.6 /100 | #113 | Exceptional 11.7% |
| Immigrants | Norway | 95.9 /100 | #114 | Exceptional 11.7% |
| Lithuanians | 95.7 /100 | #115 | Exceptional 11.7% |
| Immigrants | Iraq | 95.4 /100 | #116 | Exceptional 11.7% |
| Immigrants | Uganda | 95.3 /100 | #117 | Exceptional 11.7% |
| Ecuadorians | 95.3 /100 | #118 | Exceptional 11.7% |
| Syrians | 95.1 /100 | #119 | Exceptional 11.7% |
| Iraqis | 94.6 /100 | #120 | Exceptional 11.8% |
| Romanians | 94.5 /100 | #121 | Exceptional 11.8% |
| Menominee | 93.8 /100 | #122 | Exceptional 11.8% |
| Immigrants | Immigrants | 93.7 /100 | #123 | Exceptional 11.8% |
| Ugandans | 93.1 /100 | #124 | Exceptional 11.8% |
| Ukrainians | 92.3 /100 | #125 | Exceptional 11.8% |
| South American Indians | 92.1 /100 | #126 | Exceptional 11.8% |
| South Africans | 88.9 /100 | #127 | Excellent 11.8% |
| Immigrants | Ecuador | 88.9 /100 | #128 | Excellent 11.8% |
| Immigrants | St. Vincent and the Grenadines | 88.4 /100 | #129 | Excellent 11.8% |
| Immigrants | Austria | 88.2 /100 | #130 | Excellent 11.8% |
| Immigrants | Cambodia | 88.2 /100 | #131 | Excellent 11.8% |