Immigrants from St. Vincent and the Grenadines vs American Married-couple Households
COMPARE
Immigrants from St. Vincent and the Grenadines
American
Married-couple Households
Married-couple Households Comparison
Immigrants from St. Vincent and the Grenadines
Americans
38.7%
MARRIED-COUPLE HOUSEHOLDS
0.0/ 100
METRIC RATING
334th/ 347
METRIC RANK
47.9%
MARRIED-COUPLE HOUSEHOLDS
96.9/ 100
METRIC RATING
94th/ 347
METRIC RANK
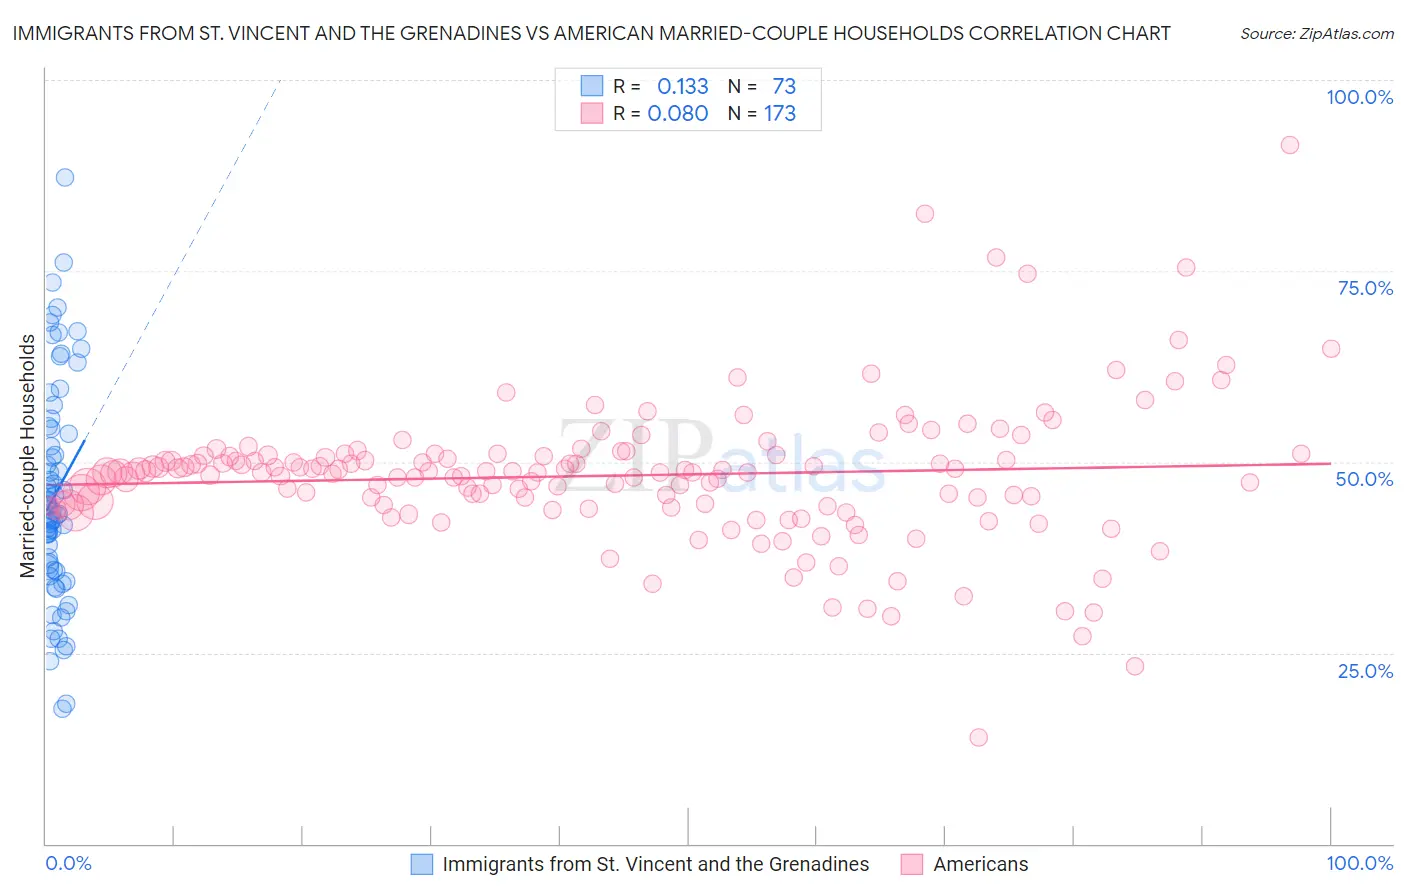
Immigrants from St. Vincent and the Grenadines vs American Married-couple Households Correlation Chart
The statistical analysis conducted on geographies consisting of 56,188,620 people shows a poor positive correlation between the proportion of Immigrants from St. Vincent and the Grenadines and percentage of married-couple family households in the United States with a correlation coefficient (R) of 0.133 and weighted average of 38.7%. Similarly, the statistical analysis conducted on geographies consisting of 581,345,567 people shows a slight positive correlation between the proportion of Americans and percentage of married-couple family households in the United States with a correlation coefficient (R) of 0.080 and weighted average of 47.9%, a difference of 23.9%.
Married-couple Households Correlation Summary
| Measurement | Immigrants from St. Vincent and the Grenadines | American |
| Minimum | 17.7% | 14.0% |
| Maximum | 87.2% | 91.6% |
| Range | 69.5% | 77.6% |
| Mean | 45.8% | 48.2% |
| Median | 43.5% | 48.6% |
| Interquartile 25% (IQ1) | 35.8% | 44.4% |
| Interquartile 75% (IQ3) | 54.5% | 50.8% |
| Interquartile Range (IQR) | 18.8% | 6.4% |
| Standard Deviation (Sample) | 14.4% | 9.2% |
| Standard Deviation (Population) | 14.3% | 9.2% |
Similar Demographics by Married-couple Households
Demographics Similar to Immigrants from St. Vincent and the Grenadines by Married-couple Households
In terms of married-couple households, the demographic groups most similar to Immigrants from St. Vincent and the Grenadines are Senegalese (38.6%, a difference of 0.33%), Black/African American (38.5%, a difference of 0.51%), Immigrants from Somalia (38.4%, a difference of 0.66%), Immigrants from West Indies (39.0%, a difference of 0.78%), and Somali (39.0%, a difference of 0.81%).
| Demographics | Rating | Rank | Married-couple Households |
| Lumbee | 0.0 /100 | #327 | Tragic 39.6% |
| Barbadians | 0.0 /100 | #328 | Tragic 39.4% |
| Immigrants | Dominica | 0.0 /100 | #329 | Tragic 39.4% |
| Immigrants | Barbados | 0.0 /100 | #330 | Tragic 39.2% |
| Immigrants | Congo | 0.0 /100 | #331 | Tragic 39.0% |
| Somalis | 0.0 /100 | #332 | Tragic 39.0% |
| Immigrants | West Indies | 0.0 /100 | #333 | Tragic 39.0% |
| Immigrants | St. Vincent and the Grenadines | 0.0 /100 | #334 | Tragic 38.7% |
| Senegalese | 0.0 /100 | #335 | Tragic 38.6% |
| Blacks/African Americans | 0.0 /100 | #336 | Tragic 38.5% |
| Immigrants | Somalia | 0.0 /100 | #337 | Tragic 38.4% |
| Immigrants | Senegal | 0.0 /100 | #338 | Tragic 38.4% |
| British West Indians | 0.0 /100 | #339 | Tragic 38.3% |
| Dominicans | 0.0 /100 | #340 | Tragic 38.2% |
| Cape Verdeans | 0.0 /100 | #341 | Tragic 38.1% |
Demographics Similar to Americans by Married-couple Households
In terms of married-couple households, the demographic groups most similar to Americans are Lebanese (47.9%, a difference of 0.0%), Palestinian (48.0%, a difference of 0.020%), Immigrants from Belgium (47.9%, a difference of 0.030%), Immigrants from Moldova (48.0%, a difference of 0.040%), and Immigrants from Egypt (47.9%, a difference of 0.080%).
| Demographics | Rating | Rank | Married-couple Households |
| Immigrants | Ireland | 97.3 /100 | #87 | Exceptional 48.0% |
| Afghans | 97.3 /100 | #88 | Exceptional 48.0% |
| Cypriots | 97.2 /100 | #89 | Exceptional 48.0% |
| French | 97.2 /100 | #90 | Exceptional 48.0% |
| Immigrants | Moldova | 97.0 /100 | #91 | Exceptional 48.0% |
| Palestinians | 96.9 /100 | #92 | Exceptional 48.0% |
| Lebanese | 96.9 /100 | #93 | Exceptional 47.9% |
| Americans | 96.9 /100 | #94 | Exceptional 47.9% |
| Immigrants | Belgium | 96.8 /100 | #95 | Exceptional 47.9% |
| Immigrants | Egypt | 96.6 /100 | #96 | Exceptional 47.9% |
| Latvians | 96.5 /100 | #97 | Exceptional 47.9% |
| Immigrants | North Macedonia | 96.4 /100 | #98 | Exceptional 47.9% |
| Immigrants | Austria | 96.4 /100 | #99 | Exceptional 47.9% |
| Immigrants | Italy | 96.3 /100 | #100 | Exceptional 47.9% |
| Turks | 96.1 /100 | #101 | Exceptional 47.8% |