Immigrants from Southern Europe vs Luxembourger Currently Married
COMPARE
Immigrants from Southern Europe
Luxembourger
Currently Married
Currently Married Comparison
Immigrants from Southern Europe
Luxembourgers
46.9%
CURRENTLY MARRIED
65.9/ 100
METRIC RATING
161st/ 347
METRIC RANK
49.3%
CURRENTLY MARRIED
99.8/ 100
METRIC RATING
20th/ 347
METRIC RANK
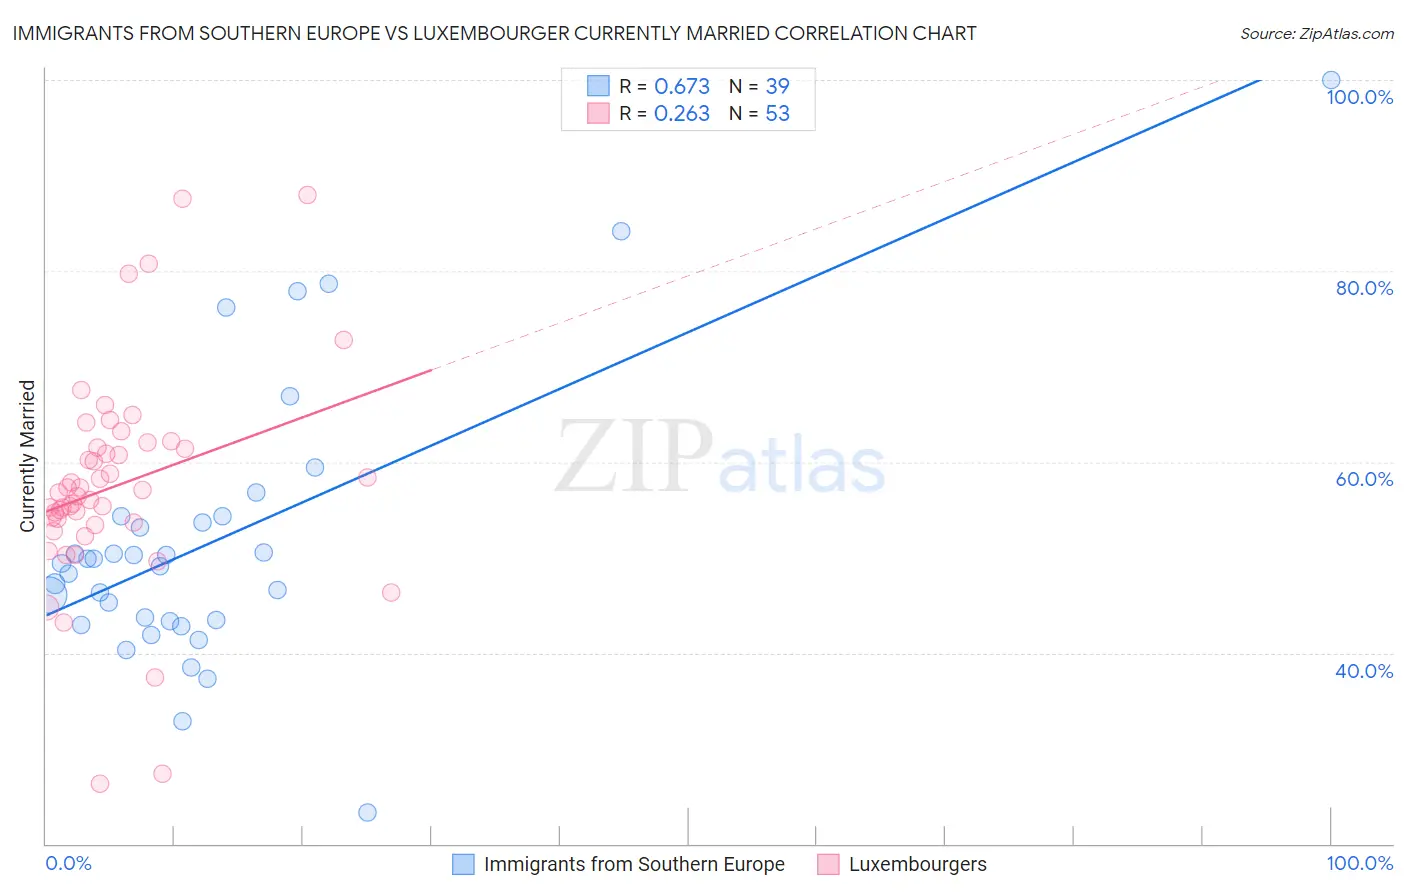
Immigrants from Southern Europe vs Luxembourger Currently Married Correlation Chart
The statistical analysis conducted on geographies consisting of 402,740,991 people shows a significant positive correlation between the proportion of Immigrants from Southern Europe and percentage of population currently married in the United States with a correlation coefficient (R) of 0.673 and weighted average of 46.9%. Similarly, the statistical analysis conducted on geographies consisting of 144,673,478 people shows a weak positive correlation between the proportion of Luxembourgers and percentage of population currently married in the United States with a correlation coefficient (R) of 0.263 and weighted average of 49.3%, a difference of 5.0%.
Currently Married Correlation Summary
| Measurement | Immigrants from Southern Europe | Luxembourger |
| Minimum | 23.3% | 26.3% |
| Maximum | 100.0% | 88.0% |
| Range | 76.7% | 61.7% |
| Mean | 51.7% | 57.5% |
| Median | 49.3% | 56.7% |
| Interquartile 25% (IQ1) | 43.3% | 53.5% |
| Interquartile 75% (IQ3) | 54.2% | 61.7% |
| Interquartile Range (IQR) | 10.9% | 8.2% |
| Standard Deviation (Sample) | 14.7% | 11.4% |
| Standard Deviation (Population) | 14.5% | 11.2% |
Similar Demographics by Currently Married
Demographics Similar to Immigrants from Southern Europe by Currently Married
In terms of currently married, the demographic groups most similar to Immigrants from Southern Europe are Immigrants from Uzbekistan (46.9%, a difference of 0.0%), Iraqi (46.9%, a difference of 0.020%), Nonimmigrants (46.9%, a difference of 0.020%), Cherokee (46.9%, a difference of 0.030%), and Delaware (46.9%, a difference of 0.050%).
| Demographics | Rating | Rank | Currently Married |
| Albanians | 68.6 /100 | #154 | Good 47.0% |
| Arabs | 68.6 /100 | #155 | Good 47.0% |
| Spanish | 68.1 /100 | #156 | Good 47.0% |
| Immigrants | Switzerland | 67.8 /100 | #157 | Good 46.9% |
| Cherokee | 66.8 /100 | #158 | Good 46.9% |
| Iraqis | 66.4 /100 | #159 | Good 46.9% |
| Immigrants | Uzbekistan | 66.0 /100 | #160 | Good 46.9% |
| Immigrants | Southern Europe | 65.9 /100 | #161 | Good 46.9% |
| Immigrants | Nonimmigrants | 65.4 /100 | #162 | Good 46.9% |
| Delaware | 64.7 /100 | #163 | Good 46.9% |
| Immigrants | Western Asia | 64.2 /100 | #164 | Good 46.9% |
| Samoans | 59.8 /100 | #165 | Average 46.8% |
| Immigrants | Syria | 59.3 /100 | #166 | Average 46.8% |
| Spaniards | 58.8 /100 | #167 | Average 46.8% |
| Immigrants | Afghanistan | 58.2 /100 | #168 | Average 46.8% |
Demographics Similar to Luxembourgers by Currently Married
In terms of currently married, the demographic groups most similar to Luxembourgers are Scottish (49.2%, a difference of 0.11%), European (49.3%, a difference of 0.14%), Immigrants from Scotland (49.3%, a difference of 0.15%), Bulgarian (49.1%, a difference of 0.33%), and Scandinavian (49.5%, a difference of 0.44%).
| Demographics | Rating | Rank | Currently Married |
| Dutch | 99.9 /100 | #13 | Exceptional 49.6% |
| Germans | 99.9 /100 | #14 | Exceptional 49.6% |
| Pennsylvania Germans | 99.9 /100 | #15 | Exceptional 49.6% |
| Chinese | 99.9 /100 | #16 | Exceptional 49.5% |
| Scandinavians | 99.9 /100 | #17 | Exceptional 49.5% |
| Immigrants | Scotland | 99.8 /100 | #18 | Exceptional 49.3% |
| Europeans | 99.8 /100 | #19 | Exceptional 49.3% |
| Luxembourgers | 99.8 /100 | #20 | Exceptional 49.3% |
| Scottish | 99.8 /100 | #21 | Exceptional 49.2% |
| Bulgarians | 99.7 /100 | #22 | Exceptional 49.1% |
| Immigrants | Pakistan | 99.7 /100 | #23 | Exceptional 49.1% |
| Lithuanians | 99.6 /100 | #24 | Exceptional 49.0% |
| Maltese | 99.6 /100 | #25 | Exceptional 49.0% |
| Immigrants | Korea | 99.6 /100 | #26 | Exceptional 49.0% |
| Burmese | 99.6 /100 | #27 | Exceptional 48.9% |