Immigrants from South America vs Serbian Single Mother Households
COMPARE
Immigrants from South America
Serbian
Single Mother Households
Single Mother Households Comparison
Immigrants from South America
Serbians
6.7%
SINGLE MOTHER HOUSEHOLDS
11.5/ 100
METRIC RATING
207th/ 347
METRIC RANK
5.7%
SINGLE MOTHER HOUSEHOLDS
96.7/ 100
METRIC RATING
93rd/ 347
METRIC RANK
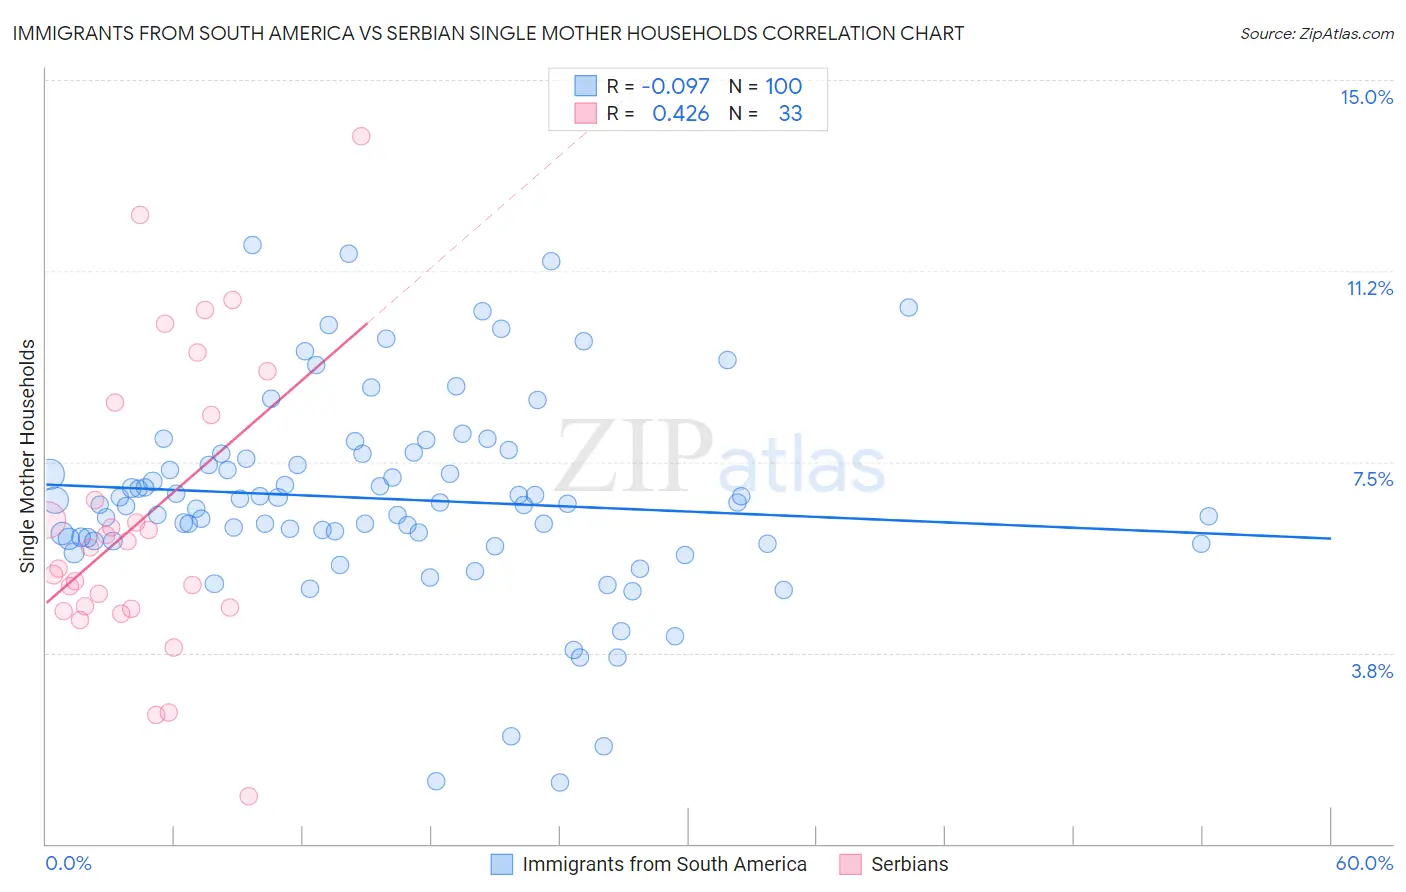
Immigrants from South America vs Serbian Single Mother Households Correlation Chart
The statistical analysis conducted on geographies consisting of 484,293,400 people shows a slight negative correlation between the proportion of Immigrants from South America and percentage of single mother households in the United States with a correlation coefficient (R) of -0.097 and weighted average of 6.7%. Similarly, the statistical analysis conducted on geographies consisting of 266,907,354 people shows a moderate positive correlation between the proportion of Serbians and percentage of single mother households in the United States with a correlation coefficient (R) of 0.426 and weighted average of 5.7%, a difference of 16.3%.
Single Mother Households Correlation Summary
| Measurement | Immigrants from South America | Serbian |
| Minimum | 1.2% | 0.92% |
| Maximum | 11.8% | 13.9% |
| Range | 10.6% | 13.0% |
| Mean | 6.8% | 6.4% |
| Median | 6.7% | 5.8% |
| Interquartile 25% (IQ1) | 6.0% | 4.6% |
| Interquartile 75% (IQ3) | 7.6% | 8.5% |
| Interquartile Range (IQR) | 1.6% | 3.9% |
| Standard Deviation (Sample) | 2.0% | 2.9% |
| Standard Deviation (Population) | 1.9% | 2.8% |
Similar Demographics by Single Mother Households
Demographics Similar to Immigrants from South America by Single Mother Households
In terms of single mother households, the demographic groups most similar to Immigrants from South America are German Russian (6.7%, a difference of 0.0%), Vietnamese (6.7%, a difference of 0.050%), Cree (6.7%, a difference of 0.080%), Immigrants from Fiji (6.7%, a difference of 0.10%), and Immigrants from Peru (6.7%, a difference of 0.11%).
| Demographics | Rating | Rank | Single Mother Households |
| Immigrants | Ethiopia | 14.7 /100 | #200 | Poor 6.6% |
| Venezuelans | 12.9 /100 | #201 | Poor 6.6% |
| Guamanians/Chamorros | 12.4 /100 | #202 | Poor 6.6% |
| Immigrants | Peru | 12.0 /100 | #203 | Poor 6.7% |
| Immigrants | Fiji | 11.9 /100 | #204 | Poor 6.7% |
| Cree | 11.9 /100 | #205 | Poor 6.7% |
| German Russians | 11.5 /100 | #206 | Poor 6.7% |
| Immigrants | South America | 11.5 /100 | #207 | Poor 6.7% |
| Vietnamese | 11.3 /100 | #208 | Poor 6.7% |
| Immigrants | Colombia | 10.5 /100 | #209 | Poor 6.7% |
| Immigrants | Nonimmigrants | 10.4 /100 | #210 | Poor 6.7% |
| Immigrants | Venezuela | 8.5 /100 | #211 | Tragic 6.7% |
| Immigrants | Eritrea | 8.4 /100 | #212 | Tragic 6.7% |
| Immigrants | Costa Rica | 8.2 /100 | #213 | Tragic 6.7% |
| Immigrants | Uruguay | 7.9 /100 | #214 | Tragic 6.7% |
Demographics Similar to Serbians by Single Mother Households
In terms of single mother households, the demographic groups most similar to Serbians are Immigrants from Western Asia (5.7%, a difference of 0.010%), Basque (5.7%, a difference of 0.050%), Slovak (5.7%, a difference of 0.11%), European (5.7%, a difference of 0.24%), and Austrian (5.7%, a difference of 0.26%).
| Demographics | Rating | Rank | Single Mother Households |
| Finns | 97.6 /100 | #86 | Exceptional 5.7% |
| Immigrants | Turkey | 97.5 /100 | #87 | Exceptional 5.7% |
| Israelis | 97.4 /100 | #88 | Exceptional 5.7% |
| Ukrainians | 97.2 /100 | #89 | Exceptional 5.7% |
| Immigrants | Indonesia | 97.2 /100 | #90 | Exceptional 5.7% |
| Europeans | 97.0 /100 | #91 | Exceptional 5.7% |
| Immigrants | Western Asia | 96.7 /100 | #92 | Exceptional 5.7% |
| Serbians | 96.7 /100 | #93 | Exceptional 5.7% |
| Basques | 96.7 /100 | #94 | Exceptional 5.7% |
| Slovaks | 96.6 /100 | #95 | Exceptional 5.7% |
| Austrians | 96.4 /100 | #96 | Exceptional 5.7% |
| Tlingit-Haida | 96.4 /100 | #97 | Exceptional 5.7% |
| Immigrants | South Africa | 96.3 /100 | #98 | Exceptional 5.7% |
| Immigrants | Poland | 96.3 /100 | #99 | Exceptional 5.8% |
| Scandinavians | 96.2 /100 | #100 | Exceptional 5.8% |