Immigrants from Somalia vs Slavic Births to Unmarried Women
COMPARE
Immigrants from Somalia
Slavic
Births to Unmarried Women
Births to Unmarried Women Comparison
Immigrants from Somalia
Slavs
31.4%
BIRTHS TO UNMARRIED WOMEN
58.1/ 100
METRIC RATING
165th/ 347
METRIC RANK
31.6%
BIRTHS TO UNMARRIED WOMEN
52.0/ 100
METRIC RATING
169th/ 347
METRIC RANK
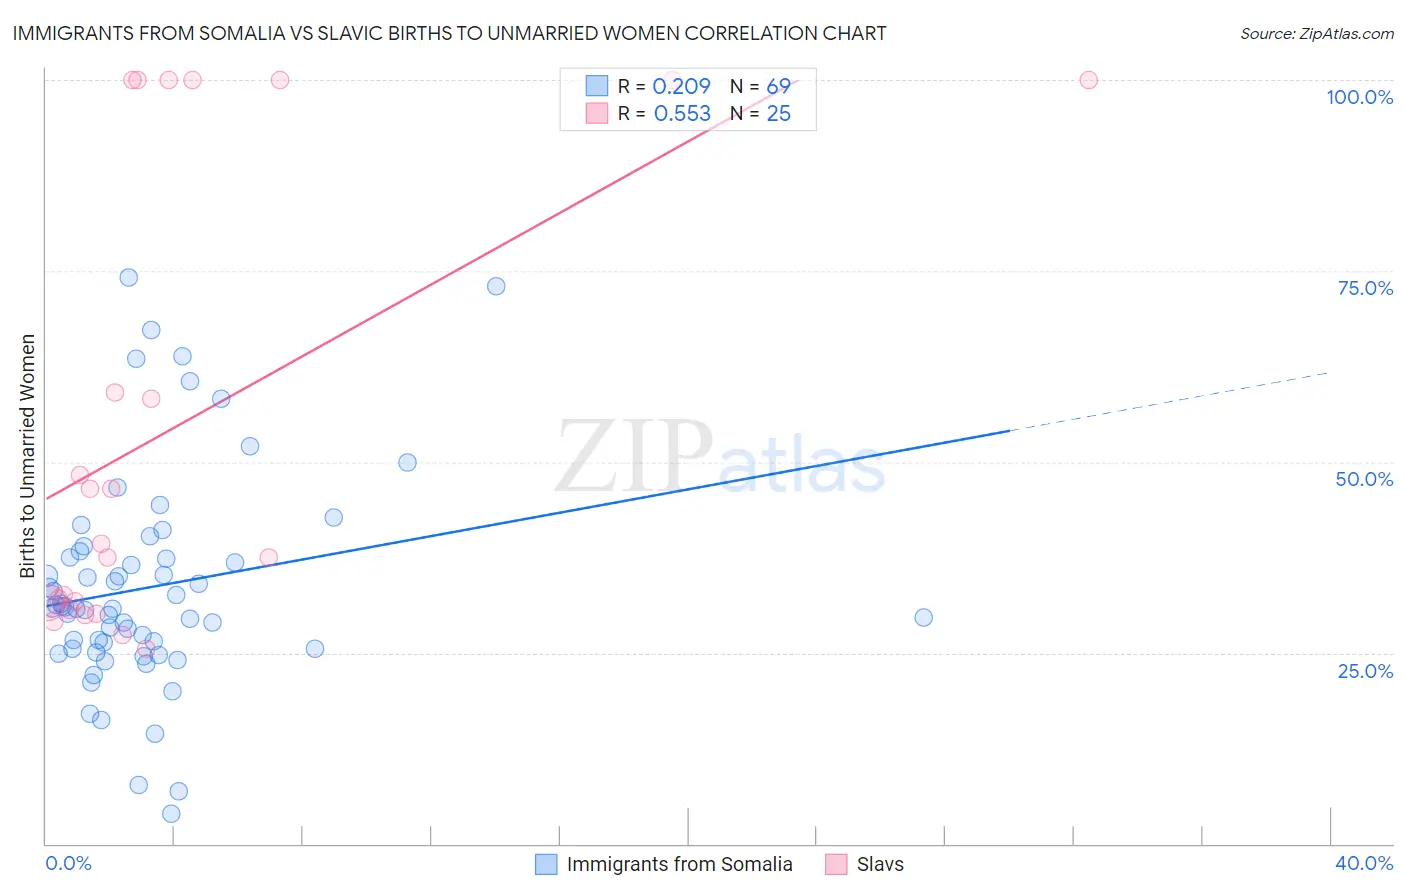
Immigrants from Somalia vs Slavic Births to Unmarried Women Correlation Chart
The statistical analysis conducted on geographies consisting of 90,738,238 people shows a weak positive correlation between the proportion of Immigrants from Somalia and percentage of births to unmarried women in the United States with a correlation coefficient (R) of 0.209 and weighted average of 31.4%. Similarly, the statistical analysis conducted on geographies consisting of 254,358,438 people shows a substantial positive correlation between the proportion of Slavs and percentage of births to unmarried women in the United States with a correlation coefficient (R) of 0.553 and weighted average of 31.6%, a difference of 0.59%.
Births to Unmarried Women Correlation Summary
| Measurement | Immigrants from Somalia | Slavic |
| Minimum | 4.0% | 25.6% |
| Maximum | 74.1% | 100.0% |
| Range | 70.1% | 74.4% |
| Mean | 33.6% | 54.9% |
| Median | 30.9% | 39.3% |
| Interquartile 25% (IQ1) | 25.5% | 31.1% |
| Interquartile 75% (IQ3) | 37.8% | 100.0% |
| Interquartile Range (IQR) | 12.3% | 68.9% |
| Standard Deviation (Sample) | 14.1% | 29.9% |
| Standard Deviation (Population) | 14.0% | 29.3% |
Demographics Similar to Immigrants from Somalia and Slavs by Births to Unmarried Women
In terms of births to unmarried women, the demographic groups most similar to Immigrants from Somalia are Peruvian (31.5%, a difference of 0.25%), Dutch (31.5%, a difference of 0.28%), Belgian (31.6%, a difference of 0.55%), Hungarian (31.2%, a difference of 0.60%), and Guamanian/Chamorro (31.6%, a difference of 0.66%). Similarly, the demographic groups most similar to Slavs are Belgian (31.6%, a difference of 0.030%), Guamanian/Chamorro (31.6%, a difference of 0.070%), Finnish (31.7%, a difference of 0.14%), Immigrants from Eritrea (31.7%, a difference of 0.15%), and Immigrants from Yemen (31.7%, a difference of 0.17%).
| Demographics | Rating | Rank | Births to Unmarried Women |
| Immigrants | Eastern Africa | 72.1 /100 | #157 | Good 31.0% |
| Austrians | 69.9 /100 | #158 | Good 31.0% |
| Immigrants | England | 69.4 /100 | #159 | Good 31.1% |
| Immigrants | Western Europe | 69.3 /100 | #160 | Good 31.1% |
| Immigrants | Southern Europe | 68.7 /100 | #161 | Good 31.1% |
| Slovenes | 65.9 /100 | #162 | Good 31.2% |
| Immigrants | Chile | 65.7 /100 | #163 | Good 31.2% |
| Hungarians | 64.1 /100 | #164 | Good 31.2% |
| Immigrants | Somalia | 58.1 /100 | #165 | Average 31.4% |
| Peruvians | 55.5 /100 | #166 | Average 31.5% |
| Dutch | 55.3 /100 | #167 | Average 31.5% |
| Belgians | 52.4 /100 | #168 | Average 31.6% |
| Slavs | 52.0 /100 | #169 | Average 31.6% |
| Guamanians/Chamorros | 51.3 /100 | #170 | Average 31.6% |
| Finns | 50.5 /100 | #171 | Average 31.7% |
| Immigrants | Eritrea | 50.4 /100 | #172 | Average 31.7% |
| Immigrants | Yemen | 50.2 /100 | #173 | Average 31.7% |
| Venezuelans | 50.0 /100 | #174 | Average 31.7% |
| Immigrants | Venezuela | 49.2 /100 | #175 | Average 31.7% |
| Scottish | 48.1 /100 | #176 | Average 31.7% |
| South American Indians | 47.7 /100 | #177 | Average 31.7% |