Immigrants from Somalia vs Kenyan Family Households with Children
COMPARE
Immigrants from Somalia
Kenyan
Family Households with Children
Family Households with Children Comparison
Immigrants from Somalia
Kenyans
26.3%
FAMILY HOUSEHOLDS WITH CHILDREN
0.0/ 100
METRIC RATING
309th/ 347
METRIC RANK
28.4%
FAMILY HOUSEHOLDS WITH CHILDREN
99.8/ 100
METRIC RATING
82nd/ 347
METRIC RANK
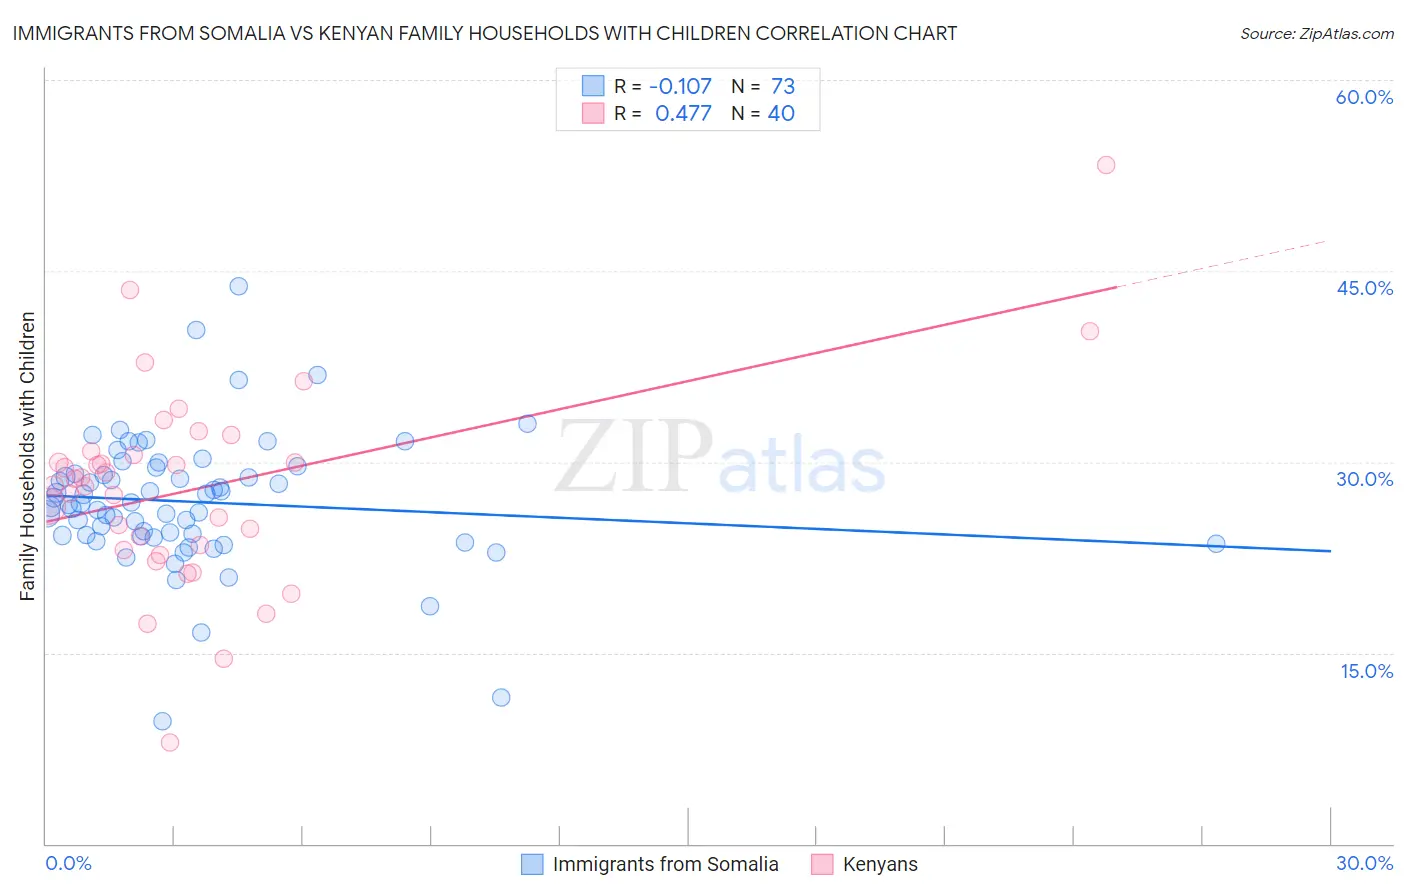
Immigrants from Somalia vs Kenyan Family Households with Children Correlation Chart
The statistical analysis conducted on geographies consisting of 92,093,079 people shows a poor negative correlation between the proportion of Immigrants from Somalia and percentage of family households with children in the United States with a correlation coefficient (R) of -0.107 and weighted average of 26.3%. Similarly, the statistical analysis conducted on geographies consisting of 168,136,016 people shows a moderate positive correlation between the proportion of Kenyans and percentage of family households with children in the United States with a correlation coefficient (R) of 0.477 and weighted average of 28.4%, a difference of 8.1%.
Family Households with Children Correlation Summary
| Measurement | Immigrants from Somalia | Kenyan |
| Minimum | 9.6% | 7.9% |
| Maximum | 43.8% | 53.3% |
| Range | 34.2% | 45.4% |
| Mean | 26.9% | 28.0% |
| Median | 26.7% | 28.4% |
| Interquartile 25% (IQ1) | 24.2% | 23.3% |
| Interquartile 75% (IQ3) | 29.3% | 30.7% |
| Interquartile Range (IQR) | 5.1% | 7.4% |
| Standard Deviation (Sample) | 5.2% | 7.9% |
| Standard Deviation (Population) | 5.2% | 7.8% |
Similar Demographics by Family Households with Children
Demographics Similar to Immigrants from Somalia by Family Households with Children
In terms of family households with children, the demographic groups most similar to Immigrants from Somalia are Marshallese (26.2%, a difference of 0.050%), Colville (26.2%, a difference of 0.090%), Lumbee (26.3%, a difference of 0.11%), West Indian (26.3%, a difference of 0.13%), and Immigrants from Czechoslovakia (26.2%, a difference of 0.16%).
| Demographics | Rating | Rank | Family Households with Children |
| Serbians | 0.1 /100 | #302 | Tragic 26.4% |
| Immigrants | Guyana | 0.1 /100 | #303 | Tragic 26.3% |
| Immigrants | Bahamas | 0.1 /100 | #304 | Tragic 26.3% |
| Guyanese | 0.1 /100 | #305 | Tragic 26.3% |
| Bermudans | 0.1 /100 | #306 | Tragic 26.3% |
| West Indians | 0.0 /100 | #307 | Tragic 26.3% |
| Lumbee | 0.0 /100 | #308 | Tragic 26.3% |
| Immigrants | Somalia | 0.0 /100 | #309 | Tragic 26.3% |
| Marshallese | 0.0 /100 | #310 | Tragic 26.2% |
| Colville | 0.0 /100 | #311 | Tragic 26.2% |
| Immigrants | Czechoslovakia | 0.0 /100 | #312 | Tragic 26.2% |
| Cree | 0.0 /100 | #313 | Tragic 26.2% |
| French Canadians | 0.0 /100 | #314 | Tragic 26.1% |
| Immigrants | Norway | 0.0 /100 | #315 | Tragic 26.1% |
| Estonians | 0.0 /100 | #316 | Tragic 26.1% |
Demographics Similar to Kenyans by Family Households with Children
In terms of family households with children, the demographic groups most similar to Kenyans are South American (28.4%, a difference of 0.040%), Nicaraguan (28.4%, a difference of 0.050%), Costa Rican (28.4%, a difference of 0.050%), Native/Alaskan (28.4%, a difference of 0.070%), and Immigrants from Syria (28.4%, a difference of 0.070%).
| Demographics | Rating | Rank | Family Households with Children |
| Immigrants | Jordan | 99.9 /100 | #75 | Exceptional 28.4% |
| Immigrants | Sri Lanka | 99.9 /100 | #76 | Exceptional 28.4% |
| Nigerians | 99.8 /100 | #77 | Exceptional 28.4% |
| Immigrants | Nepal | 99.8 /100 | #78 | Exceptional 28.4% |
| Immigrants | Iraq | 99.8 /100 | #79 | Exceptional 28.4% |
| Natives/Alaskans | 99.8 /100 | #80 | Exceptional 28.4% |
| South Americans | 99.8 /100 | #81 | Exceptional 28.4% |
| Kenyans | 99.8 /100 | #82 | Exceptional 28.4% |
| Nicaraguans | 99.8 /100 | #83 | Exceptional 28.4% |
| Costa Ricans | 99.8 /100 | #84 | Exceptional 28.4% |
| Immigrants | Syria | 99.8 /100 | #85 | Exceptional 28.4% |
| Immigrants | Western Africa | 99.6 /100 | #86 | Exceptional 28.3% |
| Colombians | 99.6 /100 | #87 | Exceptional 28.3% |
| Liberians | 99.6 /100 | #88 | Exceptional 28.3% |
| Immigrants | Costa Rica | 99.6 /100 | #89 | Exceptional 28.3% |