Immigrants from Somalia vs Immigrants from Jordan Currently Married
COMPARE
Immigrants from Somalia
Immigrants from Jordan
Currently Married
Currently Married Comparison
Immigrants from Somalia
Immigrants from Jordan
41.2%
CURRENTLY MARRIED
0.0/ 100
METRIC RATING
319th/ 347
METRIC RANK
47.4%
CURRENTLY MARRIED
84.9/ 100
METRIC RATING
126th/ 347
METRIC RANK
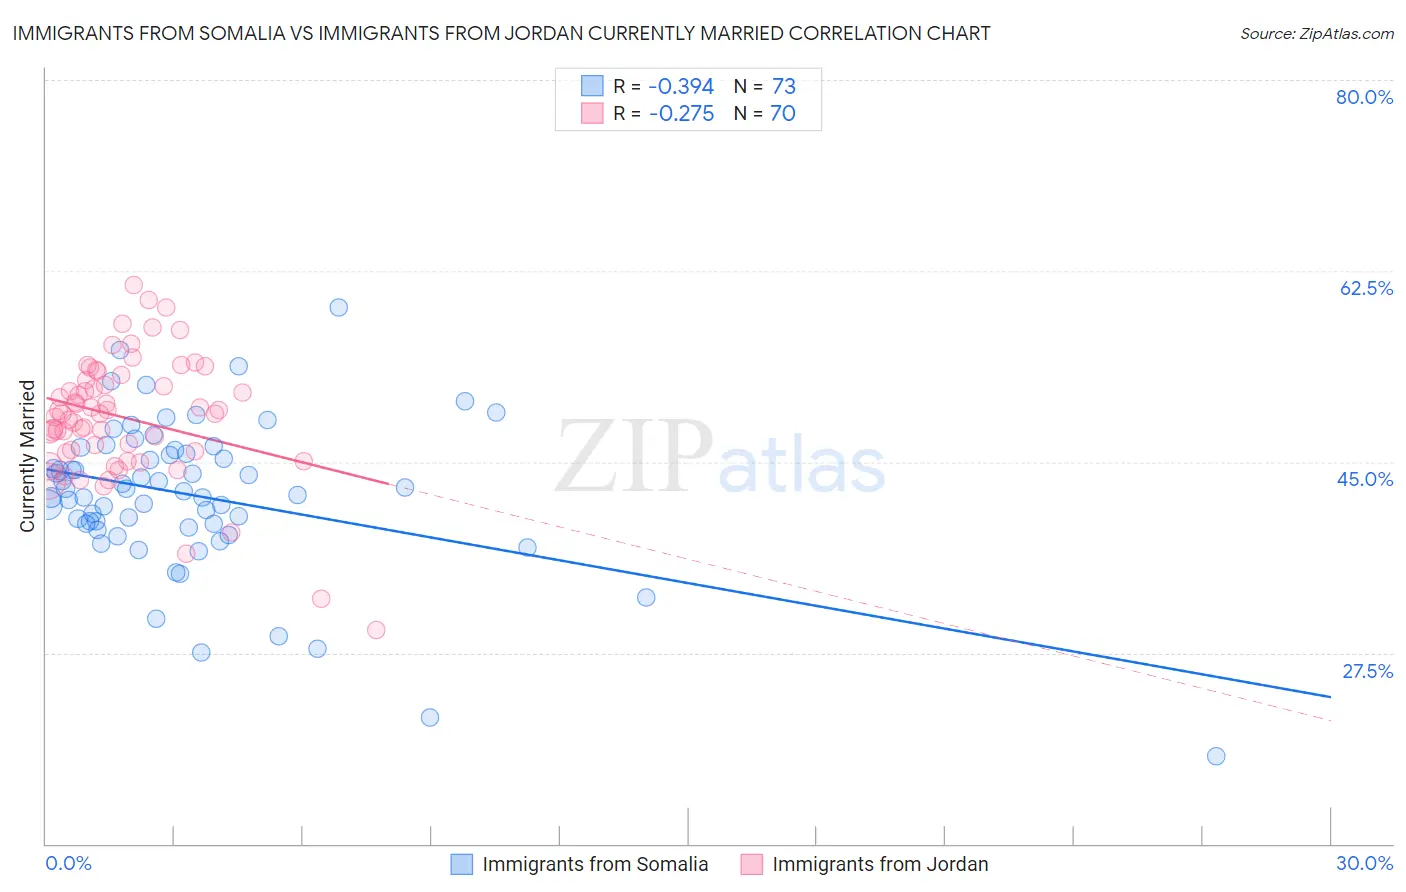
Immigrants from Somalia vs Immigrants from Jordan Currently Married Correlation Chart
The statistical analysis conducted on geographies consisting of 92,108,089 people shows a mild negative correlation between the proportion of Immigrants from Somalia and percentage of population currently married in the United States with a correlation coefficient (R) of -0.394 and weighted average of 41.2%. Similarly, the statistical analysis conducted on geographies consisting of 181,237,852 people shows a weak negative correlation between the proportion of Immigrants from Jordan and percentage of population currently married in the United States with a correlation coefficient (R) of -0.275 and weighted average of 47.4%, a difference of 15.0%.
Currently Married Correlation Summary
| Measurement | Immigrants from Somalia | Immigrants from Jordan |
| Minimum | 18.0% | 29.6% |
| Maximum | 59.1% | 61.2% |
| Range | 41.1% | 31.6% |
| Mean | 41.9% | 49.1% |
| Median | 42.3% | 49.4% |
| Interquartile 25% (IQ1) | 39.1% | 46.0% |
| Interquartile 75% (IQ3) | 45.9% | 52.5% |
| Interquartile Range (IQR) | 6.8% | 6.5% |
| Standard Deviation (Sample) | 7.0% | 5.7% |
| Standard Deviation (Population) | 6.9% | 5.6% |
Similar Demographics by Currently Married
Demographics Similar to Immigrants from Somalia by Currently Married
In terms of currently married, the demographic groups most similar to Immigrants from Somalia are Bahamian (41.2%, a difference of 0.020%), Immigrants from Jamaica (41.1%, a difference of 0.060%), Haitian (41.3%, a difference of 0.20%), Immigrants from Caribbean (41.3%, a difference of 0.22%), and Inupiat (41.3%, a difference of 0.28%).
| Demographics | Rating | Rank | Currently Married |
| Somalis | 0.0 /100 | #312 | Tragic 41.5% |
| Jamaicans | 0.0 /100 | #313 | Tragic 41.4% |
| West Indians | 0.0 /100 | #314 | Tragic 41.3% |
| Inupiat | 0.0 /100 | #315 | Tragic 41.3% |
| Immigrants | Caribbean | 0.0 /100 | #316 | Tragic 41.3% |
| Haitians | 0.0 /100 | #317 | Tragic 41.3% |
| Bahamians | 0.0 /100 | #318 | Tragic 41.2% |
| Immigrants | Somalia | 0.0 /100 | #319 | Tragic 41.2% |
| Immigrants | Jamaica | 0.0 /100 | #320 | Tragic 41.1% |
| Immigrants | Congo | 0.0 /100 | #321 | Tragic 41.1% |
| Immigrants | Haiti | 0.0 /100 | #322 | Tragic 41.0% |
| Immigrants | West Indies | 0.0 /100 | #323 | Tragic 40.7% |
| Immigrants | Senegal | 0.0 /100 | #324 | Tragic 40.7% |
| U.S. Virgin Islanders | 0.0 /100 | #325 | Tragic 40.7% |
| Barbadians | 0.0 /100 | #326 | Tragic 40.6% |
Demographics Similar to Immigrants from Jordan by Currently Married
In terms of currently married, the demographic groups most similar to Immigrants from Jordan are New Zealander (47.4%, a difference of 0.0%), Okinawan (47.4%, a difference of 0.030%), Portuguese (47.3%, a difference of 0.050%), Sri Lankan (47.3%, a difference of 0.11%), and Laotian (47.4%, a difference of 0.13%).
| Demographics | Rating | Rank | Currently Married |
| Australians | 90.2 /100 | #119 | Exceptional 47.6% |
| Syrians | 88.9 /100 | #120 | Excellent 47.5% |
| Immigrants | Croatia | 88.6 /100 | #121 | Excellent 47.5% |
| Osage | 87.9 /100 | #122 | Excellent 47.5% |
| Immigrants | Kazakhstan | 87.2 /100 | #123 | Excellent 47.4% |
| Laotians | 86.6 /100 | #124 | Excellent 47.4% |
| Okinawans | 85.3 /100 | #125 | Excellent 47.4% |
| Immigrants | Jordan | 84.9 /100 | #126 | Excellent 47.4% |
| New Zealanders | 84.9 /100 | #127 | Excellent 47.4% |
| Portuguese | 84.2 /100 | #128 | Excellent 47.3% |
| Sri Lankans | 83.2 /100 | #129 | Excellent 47.3% |
| Immigrants | Iraq | 82.8 /100 | #130 | Excellent 47.3% |
| Icelanders | 82.4 /100 | #131 | Excellent 47.3% |
| Afghans | 81.8 /100 | #132 | Excellent 47.3% |
| Immigrants | Malaysia | 81.1 /100 | #133 | Excellent 47.3% |