Immigrants from Somalia vs Hopi Divorced or Separated
COMPARE
Immigrants from Somalia
Hopi
Divorced or Separated
Divorced or Separated Comparison
Immigrants from Somalia
Hopi
12.6%
DIVORCED OR SEPARATED
0.6/ 100
METRIC RATING
257th/ 347
METRIC RANK
13.2%
DIVORCED OR SEPARATED
0.0/ 100
METRIC RATING
304th/ 347
METRIC RANK
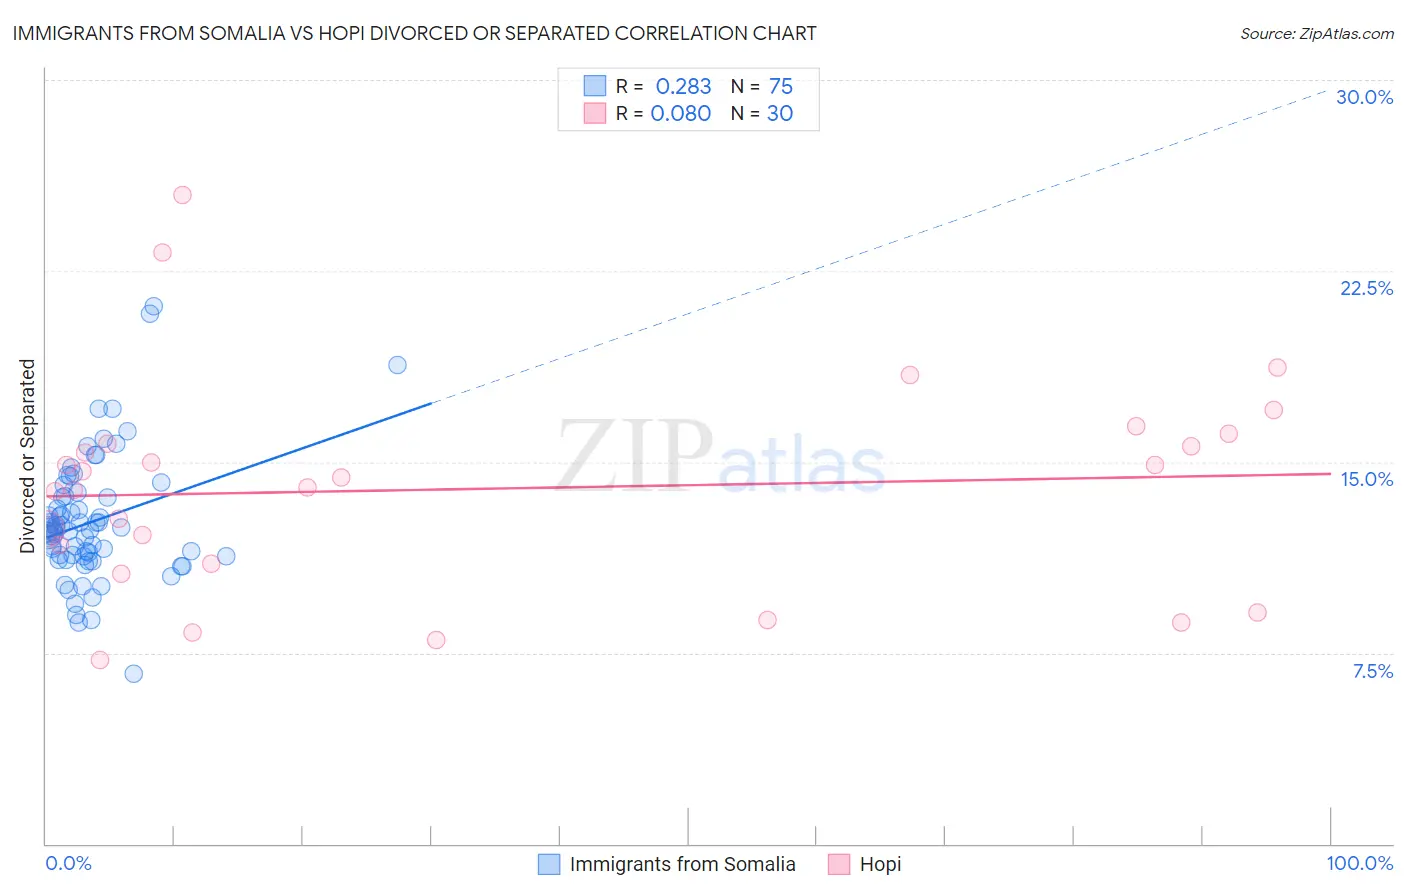
Immigrants from Somalia vs Hopi Divorced or Separated Correlation Chart
The statistical analysis conducted on geographies consisting of 92,109,510 people shows a weak positive correlation between the proportion of Immigrants from Somalia and percentage of population currently divorced or separated in the United States with a correlation coefficient (R) of 0.283 and weighted average of 12.6%. Similarly, the statistical analysis conducted on geographies consisting of 74,740,168 people shows a slight positive correlation between the proportion of Hopi and percentage of population currently divorced or separated in the United States with a correlation coefficient (R) of 0.080 and weighted average of 13.2%, a difference of 4.5%.
Divorced or Separated Correlation Summary
| Measurement | Immigrants from Somalia | Hopi |
| Minimum | 6.7% | 7.2% |
| Maximum | 21.1% | 25.5% |
| Range | 14.4% | 18.3% |
| Mean | 12.7% | 13.9% |
| Median | 12.3% | 14.2% |
| Interquartile 25% (IQ1) | 11.3% | 11.0% |
| Interquartile 75% (IQ3) | 13.6% | 15.7% |
| Interquartile Range (IQR) | 2.3% | 4.7% |
| Standard Deviation (Sample) | 2.5% | 4.2% |
| Standard Deviation (Population) | 2.5% | 4.1% |
Similar Demographics by Divorced or Separated
Demographics Similar to Immigrants from Somalia by Divorced or Separated
In terms of divorced or separated, the demographic groups most similar to Immigrants from Somalia are Indonesian (12.6%, a difference of 0.0%), Immigrants from Colombia (12.6%, a difference of 0.010%), Yuman (12.6%, a difference of 0.020%), Immigrants from Uruguay (12.6%, a difference of 0.020%), and Immigrants from Dominica (12.6%, a difference of 0.050%).
| Demographics | Rating | Rank | Divorced or Separated |
| Irish | 1.3 /100 | #250 | Tragic 12.5% |
| Aleuts | 1.3 /100 | #251 | Tragic 12.5% |
| Liberians | 0.9 /100 | #252 | Tragic 12.6% |
| Somalis | 0.9 /100 | #253 | Tragic 12.6% |
| Senegalese | 0.8 /100 | #254 | Tragic 12.6% |
| Welsh | 0.7 /100 | #255 | Tragic 12.6% |
| Immigrants | Colombia | 0.6 /100 | #256 | Tragic 12.6% |
| Immigrants | Somalia | 0.6 /100 | #257 | Tragic 12.6% |
| Indonesians | 0.6 /100 | #258 | Tragic 12.6% |
| Yuman | 0.6 /100 | #259 | Tragic 12.6% |
| Immigrants | Uruguay | 0.6 /100 | #260 | Tragic 12.6% |
| Immigrants | Dominica | 0.5 /100 | #261 | Tragic 12.6% |
| Basques | 0.5 /100 | #262 | Tragic 12.6% |
| Immigrants | Panama | 0.5 /100 | #263 | Tragic 12.6% |
| English | 0.5 /100 | #264 | Tragic 12.6% |
Demographics Similar to Hopi by Divorced or Separated
In terms of divorced or separated, the demographic groups most similar to Hopi are Chippewa (13.2%, a difference of 0.050%), Cape Verdean (13.1%, a difference of 0.13%), Immigrants from Venezuela (13.1%, a difference of 0.15%), Tlingit-Haida (13.2%, a difference of 0.22%), and Alaskan Athabascan (13.1%, a difference of 0.25%).
| Demographics | Rating | Rank | Divorced or Separated |
| Natives/Alaskans | 0.0 /100 | #297 | Tragic 13.0% |
| Venezuelans | 0.0 /100 | #298 | Tragic 13.0% |
| Immigrants | Jamaica | 0.0 /100 | #299 | Tragic 13.0% |
| Immigrants | Cabo Verde | 0.0 /100 | #300 | Tragic 13.1% |
| Alaskan Athabascans | 0.0 /100 | #301 | Tragic 13.1% |
| Immigrants | Venezuela | 0.0 /100 | #302 | Tragic 13.1% |
| Cape Verdeans | 0.0 /100 | #303 | Tragic 13.1% |
| Hopi | 0.0 /100 | #304 | Tragic 13.2% |
| Chippewa | 0.0 /100 | #305 | Tragic 13.2% |
| Tlingit-Haida | 0.0 /100 | #306 | Tragic 13.2% |
| French American Indians | 0.0 /100 | #307 | Tragic 13.2% |
| Ottawa | 0.0 /100 | #308 | Tragic 13.2% |
| Americans | 0.0 /100 | #309 | Tragic 13.2% |
| Africans | 0.0 /100 | #310 | Tragic 13.2% |
| Sioux | 0.0 /100 | #311 | Tragic 13.2% |