Immigrants from Singapore vs Puerto Rican Births to Unmarried Women
COMPARE
Immigrants from Singapore
Puerto Rican
Births to Unmarried Women
Births to Unmarried Women Comparison
Immigrants from Singapore
Puerto Ricans
25.6%
BIRTHS TO UNMARRIED WOMEN
100.0/ 100
METRIC RATING
15th/ 347
METRIC RANK
45.7%
BIRTHS TO UNMARRIED WOMEN
0.0/ 100
METRIC RATING
336th/ 347
METRIC RANK
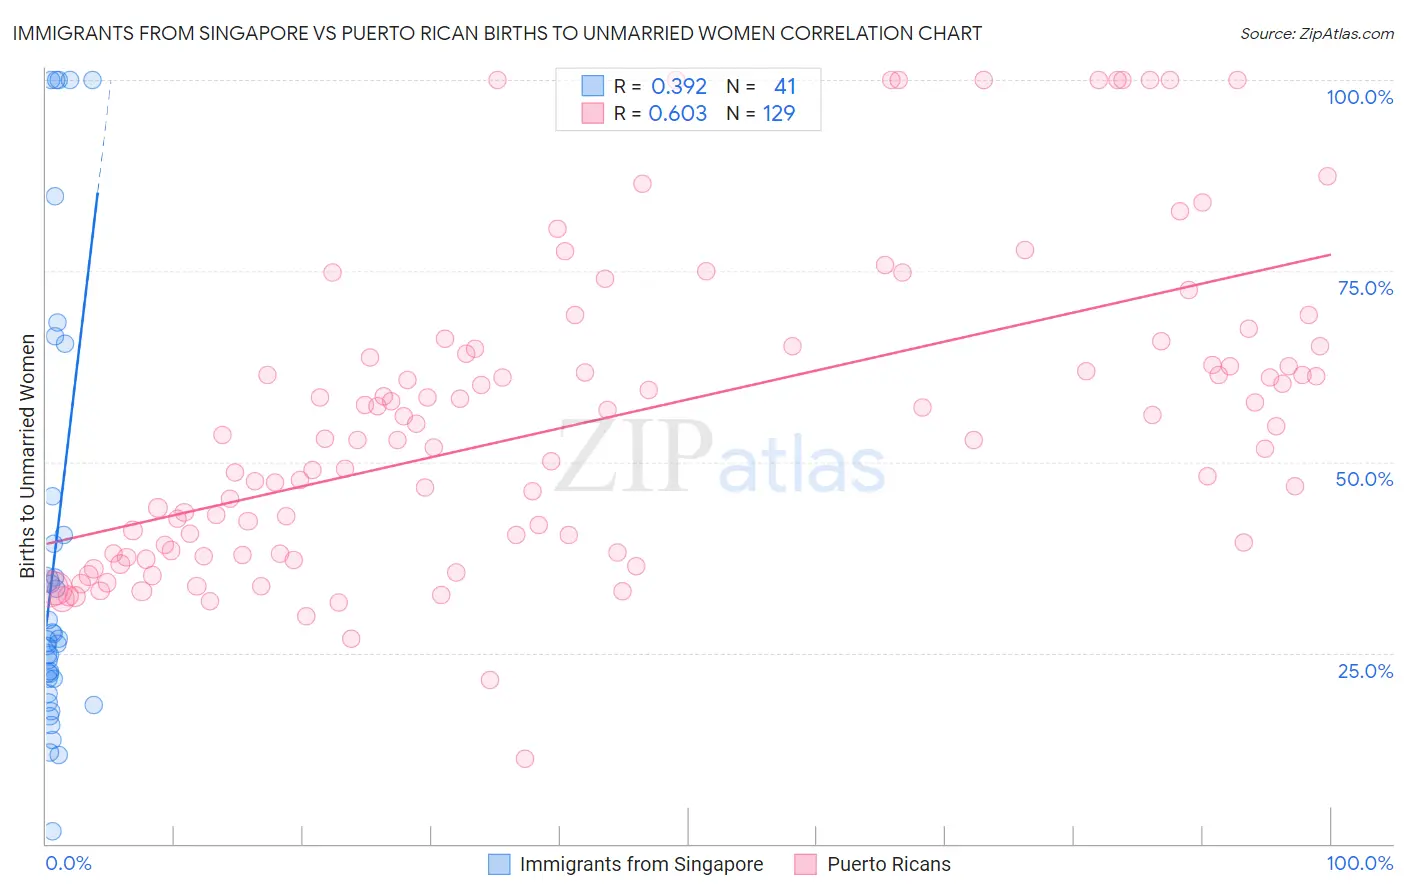
Immigrants from Singapore vs Puerto Rican Births to Unmarried Women Correlation Chart
The statistical analysis conducted on geographies consisting of 131,320,191 people shows a mild positive correlation between the proportion of Immigrants from Singapore and percentage of births to unmarried women in the United States with a correlation coefficient (R) of 0.392 and weighted average of 25.6%. Similarly, the statistical analysis conducted on geographies consisting of 481,236,419 people shows a significant positive correlation between the proportion of Puerto Ricans and percentage of births to unmarried women in the United States with a correlation coefficient (R) of 0.603 and weighted average of 45.7%, a difference of 78.2%.
Births to Unmarried Women Correlation Summary
| Measurement | Immigrants from Singapore | Puerto Rican |
| Minimum | 1.7% | 11.1% |
| Maximum | 100.0% | 100.0% |
| Range | 98.3% | 88.9% |
| Mean | 38.2% | 55.2% |
| Median | 26.5% | 53.0% |
| Interquartile 25% (IQ1) | 20.6% | 38.0% |
| Interquartile 75% (IQ3) | 43.0% | 64.5% |
| Interquartile Range (IQR) | 22.4% | 26.5% |
| Standard Deviation (Sample) | 28.5% | 20.1% |
| Standard Deviation (Population) | 28.1% | 20.0% |
Similar Demographics by Births to Unmarried Women
Demographics Similar to Immigrants from Singapore by Births to Unmarried Women
In terms of births to unmarried women, the demographic groups most similar to Immigrants from Singapore are Immigrants from Belarus (25.6%, a difference of 0.050%), Immigrants from Uzbekistan (25.8%, a difference of 0.62%), Immigrants from Lebanon (25.3%, a difference of 1.2%), Iranian (25.3%, a difference of 1.3%), and Indian (Asian) (25.3%, a difference of 1.4%).
| Demographics | Rating | Rank | Births to Unmarried Women |
| Immigrants | China | 100.0 /100 | #8 | Exceptional 24.7% |
| Immigrants | South Central Asia | 100.0 /100 | #9 | Exceptional 24.7% |
| Immigrants | Eastern Asia | 100.0 /100 | #10 | Exceptional 25.0% |
| Immigrants | Israel | 100.0 /100 | #11 | Exceptional 25.1% |
| Indians (Asian) | 100.0 /100 | #12 | Exceptional 25.3% |
| Iranians | 100.0 /100 | #13 | Exceptional 25.3% |
| Immigrants | Lebanon | 100.0 /100 | #14 | Exceptional 25.3% |
| Immigrants | Singapore | 100.0 /100 | #15 | Exceptional 25.6% |
| Immigrants | Belarus | 100.0 /100 | #16 | Exceptional 25.6% |
| Immigrants | Uzbekistan | 100.0 /100 | #17 | Exceptional 25.8% |
| Immigrants | Armenia | 99.9 /100 | #18 | Exceptional 26.1% |
| Armenians | 99.9 /100 | #19 | Exceptional 26.2% |
| Immigrants | Korea | 99.9 /100 | #20 | Exceptional 26.3% |
| Soviet Union | 99.9 /100 | #21 | Exceptional 26.3% |
| Burmese | 99.9 /100 | #22 | Exceptional 26.4% |
Demographics Similar to Puerto Ricans by Births to Unmarried Women
In terms of births to unmarried women, the demographic groups most similar to Puerto Ricans are Colville (45.3%, a difference of 0.78%), Houma (46.6%, a difference of 1.9%), Yuman (44.4%, a difference of 2.9%), Black/African American (44.3%, a difference of 3.1%), and Arapaho (47.1%, a difference of 3.2%).
| Demographics | Rating | Rank | Births to Unmarried Women |
| Paiute | 0.0 /100 | #329 | Tragic 42.5% |
| Chippewa | 0.0 /100 | #330 | Tragic 42.6% |
| Natives/Alaskans | 0.0 /100 | #331 | Tragic 43.0% |
| Kiowa | 0.0 /100 | #332 | Tragic 43.1% |
| Blacks/African Americans | 0.0 /100 | #333 | Tragic 44.3% |
| Yuman | 0.0 /100 | #334 | Tragic 44.4% |
| Colville | 0.0 /100 | #335 | Tragic 45.3% |
| Puerto Ricans | 0.0 /100 | #336 | Tragic 45.7% |
| Houma | 0.0 /100 | #337 | Tragic 46.6% |
| Arapaho | 0.0 /100 | #338 | Tragic 47.1% |
| Lumbee | 0.0 /100 | #339 | Tragic 48.2% |
| Tohono O'odham | 0.0 /100 | #340 | Tragic 49.8% |
| Hopi | 0.0 /100 | #341 | Tragic 50.8% |
| Menominee | 0.0 /100 | #342 | Tragic 51.1% |
| Pima | 0.0 /100 | #343 | Tragic 51.5% |