Immigrants from Sierra Leone vs Immigrants from Portugal Single Father Households
COMPARE
Immigrants from Sierra Leone
Immigrants from Portugal
Single Father Households
Single Father Households Comparison
Immigrants from Sierra Leone
Immigrants from Portugal
2.5%
SINGLE FATHER HOUSEHOLDS
5.8/ 100
METRIC RATING
238th/ 347
METRIC RANK
2.6%
SINGLE FATHER HOUSEHOLDS
0.1/ 100
METRIC RATING
280th/ 347
METRIC RANK
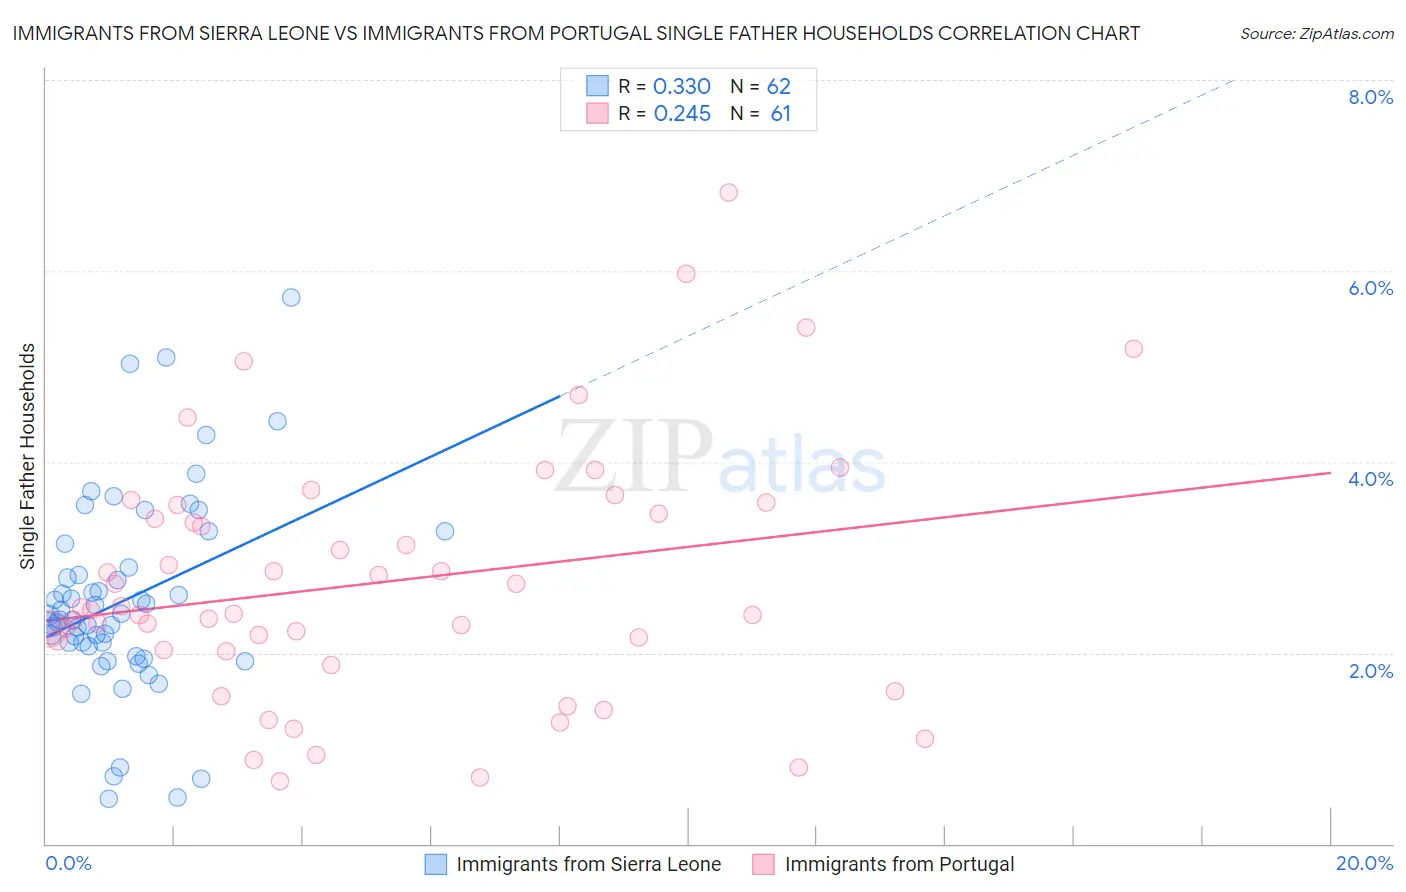
Immigrants from Sierra Leone vs Immigrants from Portugal Single Father Households Correlation Chart
The statistical analysis conducted on geographies consisting of 101,470,770 people shows a mild positive correlation between the proportion of Immigrants from Sierra Leone and percentage of single father households in the United States with a correlation coefficient (R) of 0.330 and weighted average of 2.5%. Similarly, the statistical analysis conducted on geographies consisting of 173,713,096 people shows a weak positive correlation between the proportion of Immigrants from Portugal and percentage of single father households in the United States with a correlation coefficient (R) of 0.245 and weighted average of 2.6%, a difference of 7.3%.
Single Father Households Correlation Summary
| Measurement | Immigrants from Sierra Leone | Immigrants from Portugal |
| Minimum | 0.47% | 0.66% |
| Maximum | 5.7% | 6.8% |
| Range | 5.3% | 6.2% |
| Mean | 2.5% | 2.7% |
| Median | 2.4% | 2.5% |
| Interquartile 25% (IQ1) | 2.1% | 2.0% |
| Interquartile 75% (IQ3) | 2.9% | 3.5% |
| Interquartile Range (IQR) | 0.83% | 1.5% |
| Standard Deviation (Sample) | 1.0% | 1.3% |
| Standard Deviation (Population) | 1.0% | 1.3% |
Similar Demographics by Single Father Households
Demographics Similar to Immigrants from Sierra Leone by Single Father Households
In terms of single father households, the demographic groups most similar to Immigrants from Sierra Leone are Immigrants from Oceania (2.5%, a difference of 0.010%), Sierra Leonean (2.5%, a difference of 0.030%), Cajun (2.5%, a difference of 0.080%), Immigrants (2.5%, a difference of 0.13%), and African (2.5%, a difference of 0.15%).
| Demographics | Rating | Rank | Single Father Households |
| Immigrants | Nonimmigrants | 7.6 /100 | #231 | Tragic 2.4% |
| Pennsylvania Germans | 7.3 /100 | #232 | Tragic 2.4% |
| Immigrants | Western Africa | 7.0 /100 | #233 | Tragic 2.4% |
| Africans | 6.3 /100 | #234 | Tragic 2.5% |
| Immigrants | Immigrants | 6.3 /100 | #235 | Tragic 2.5% |
| Cajuns | 6.1 /100 | #236 | Tragic 2.5% |
| Sierra Leoneans | 5.9 /100 | #237 | Tragic 2.5% |
| Immigrants | Sierra Leone | 5.8 /100 | #238 | Tragic 2.5% |
| Immigrants | Oceania | 5.8 /100 | #239 | Tragic 2.5% |
| Immigrants | Dominica | 4.8 /100 | #240 | Tragic 2.5% |
| Portuguese | 4.1 /100 | #241 | Tragic 2.5% |
| Osage | 4.1 /100 | #242 | Tragic 2.5% |
| Spaniards | 3.1 /100 | #243 | Tragic 2.5% |
| Immigrants | Middle Africa | 2.8 /100 | #244 | Tragic 2.5% |
| Basques | 2.5 /100 | #245 | Tragic 2.5% |
Demographics Similar to Immigrants from Portugal by Single Father Households
In terms of single father households, the demographic groups most similar to Immigrants from Portugal are Nicaraguan (2.6%, a difference of 0.010%), Dutch West Indian (2.6%, a difference of 0.060%), Samoan (2.6%, a difference of 0.55%), Cherokee (2.6%, a difference of 0.59%), and Shoshone (2.6%, a difference of 0.64%).
| Demographics | Rating | Rank | Single Father Households |
| Iroquois | 0.2 /100 | #273 | Tragic 2.6% |
| Puerto Ricans | 0.2 /100 | #274 | Tragic 2.6% |
| Immigrants | Dominican Republic | 0.2 /100 | #275 | Tragic 2.6% |
| Immigrants | Haiti | 0.1 /100 | #276 | Tragic 2.6% |
| Shoshone | 0.1 /100 | #277 | Tragic 2.6% |
| Cherokee | 0.1 /100 | #278 | Tragic 2.6% |
| Samoans | 0.1 /100 | #279 | Tragic 2.6% |
| Immigrants | Portugal | 0.1 /100 | #280 | Tragic 2.6% |
| Nicaraguans | 0.1 /100 | #281 | Tragic 2.6% |
| Dutch West Indians | 0.1 /100 | #282 | Tragic 2.6% |
| Immigrants | Nicaragua | 0.1 /100 | #283 | Tragic 2.7% |
| Hawaiians | 0.1 /100 | #284 | Tragic 2.7% |
| Ottawa | 0.1 /100 | #285 | Tragic 2.7% |
| Immigrants | Cuba | 0.1 /100 | #286 | Tragic 2.7% |
| Central American Indians | 0.0 /100 | #287 | Tragic 2.7% |