Immigrants from Serbia vs Immigrants from Cuba Family Households with Children
COMPARE
Immigrants from Serbia
Immigrants from Cuba
Family Households with Children
Family Households with Children Comparison
Immigrants from Serbia
Immigrants from Cuba
25.5%
FAMILY HOUSEHOLDS WITH CHILDREN
0.0/ 100
METRIC RATING
341st/ 347
METRIC RANK
26.8%
FAMILY HOUSEHOLDS WITH CHILDREN
1.3/ 100
METRIC RATING
258th/ 347
METRIC RANK
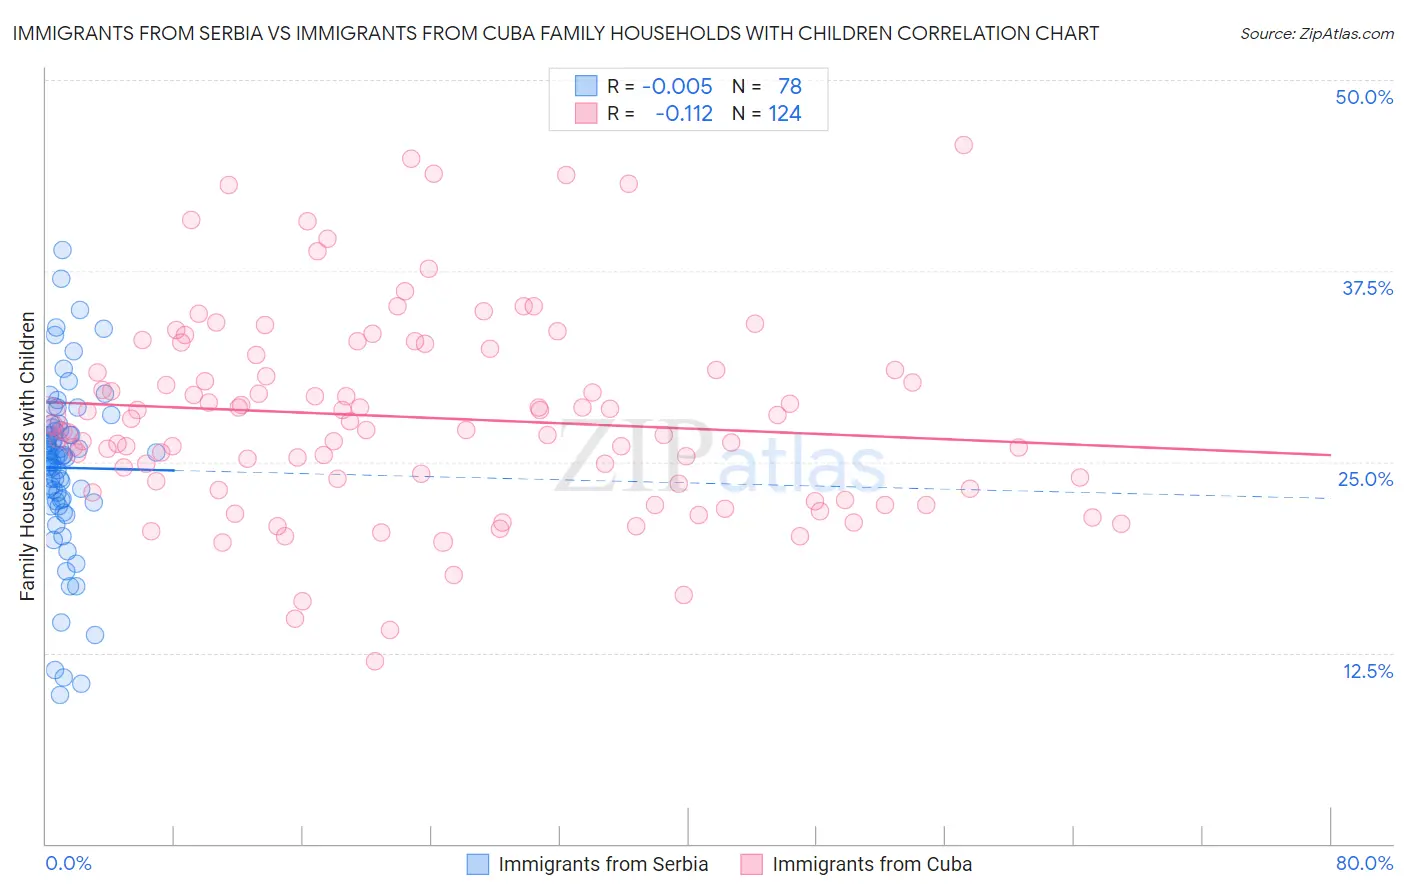
Immigrants from Serbia vs Immigrants from Cuba Family Households with Children Correlation Chart
The statistical analysis conducted on geographies consisting of 131,676,754 people shows no correlation between the proportion of Immigrants from Serbia and percentage of family households with children in the United States with a correlation coefficient (R) of -0.005 and weighted average of 25.5%. Similarly, the statistical analysis conducted on geographies consisting of 325,830,248 people shows a poor negative correlation between the proportion of Immigrants from Cuba and percentage of family households with children in the United States with a correlation coefficient (R) of -0.112 and weighted average of 26.8%, a difference of 5.2%.
Family Households with Children Correlation Summary
| Measurement | Immigrants from Serbia | Immigrants from Cuba |
| Minimum | 9.7% | 11.9% |
| Maximum | 38.8% | 45.7% |
| Range | 29.1% | 33.8% |
| Mean | 24.6% | 27.9% |
| Median | 25.3% | 27.3% |
| Interquartile 25% (IQ1) | 22.4% | 23.4% |
| Interquartile 75% (IQ3) | 27.1% | 31.5% |
| Interquartile Range (IQR) | 4.7% | 8.1% |
| Standard Deviation (Sample) | 5.6% | 6.6% |
| Standard Deviation (Population) | 5.5% | 6.6% |
Similar Demographics by Family Households with Children
Demographics Similar to Immigrants from Serbia by Family Households with Children
In terms of family households with children, the demographic groups most similar to Immigrants from Serbia are Immigrants from Armenia (25.6%, a difference of 0.38%), Immigrants from St. Vincent and the Grenadines (25.6%, a difference of 0.42%), Arapaho (25.6%, a difference of 0.43%), Puerto Rican (25.6%, a difference of 0.46%), and Alsatian (25.3%, a difference of 0.68%).
| Demographics | Rating | Rank | Family Households with Children |
| Immigrants | Switzerland | 0.0 /100 | #333 | Tragic 25.7% |
| Slovaks | 0.0 /100 | #334 | Tragic 25.7% |
| Immigrants | Croatia | 0.0 /100 | #335 | Tragic 25.7% |
| Immigrants | West Indies | 0.0 /100 | #336 | Tragic 25.7% |
| Puerto Ricans | 0.0 /100 | #337 | Tragic 25.6% |
| Arapaho | 0.0 /100 | #338 | Tragic 25.6% |
| Immigrants | St. Vincent and the Grenadines | 0.0 /100 | #339 | Tragic 25.6% |
| Immigrants | Armenia | 0.0 /100 | #340 | Tragic 25.6% |
| Immigrants | Serbia | 0.0 /100 | #341 | Tragic 25.5% |
| Alsatians | 0.0 /100 | #342 | Tragic 25.3% |
| Hopi | 0.0 /100 | #343 | Tragic 25.2% |
| Pueblo | 0.0 /100 | #344 | Tragic 25.2% |
| Immigrants | Grenada | 0.0 /100 | #345 | Tragic 25.2% |
| Carpatho Rusyns | 0.0 /100 | #346 | Tragic 25.2% |
| Soviet Union | 0.0 /100 | #347 | Tragic 24.8% |
Demographics Similar to Immigrants from Cuba by Family Households with Children
In terms of family households with children, the demographic groups most similar to Immigrants from Cuba are Slavic (26.8%, a difference of 0.010%), Immigrants from Lithuania (26.8%, a difference of 0.030%), Scotch-Irish (26.8%, a difference of 0.050%), Immigrants from Jamaica (26.8%, a difference of 0.050%), and Immigrants from Scotland (26.8%, a difference of 0.070%).
| Demographics | Rating | Rank | Family Households with Children |
| Immigrants | Bosnia and Herzegovina | 1.9 /100 | #251 | Tragic 26.8% |
| Irish | 1.8 /100 | #252 | Tragic 26.8% |
| Italians | 1.5 /100 | #253 | Tragic 26.8% |
| Immigrants | Scotland | 1.5 /100 | #254 | Tragic 26.8% |
| German Russians | 1.5 /100 | #255 | Tragic 26.8% |
| Scotch-Irish | 1.4 /100 | #256 | Tragic 26.8% |
| Slavs | 1.3 /100 | #257 | Tragic 26.8% |
| Immigrants | Cuba | 1.3 /100 | #258 | Tragic 26.8% |
| Immigrants | Lithuania | 1.2 /100 | #259 | Tragic 26.8% |
| Immigrants | Jamaica | 1.2 /100 | #260 | Tragic 26.8% |
| Immigrants | Belarus | 1.1 /100 | #261 | Tragic 26.8% |
| Immigrants | Russia | 1.0 /100 | #262 | Tragic 26.8% |
| Immigrants | North Macedonia | 1.0 /100 | #263 | Tragic 26.7% |
| Taiwanese | 0.9 /100 | #264 | Tragic 26.7% |
| Chippewa | 0.9 /100 | #265 | Tragic 26.7% |