Immigrants from Serbia vs Belizean Currently Married
COMPARE
Immigrants from Serbia
Belizean
Currently Married
Currently Married Comparison
Immigrants from Serbia
Belizeans
47.0%
CURRENTLY MARRIED
68.8/ 100
METRIC RATING
152nd/ 347
METRIC RANK
42.2%
CURRENTLY MARRIED
0.0/ 100
METRIC RATING
300th/ 347
METRIC RANK
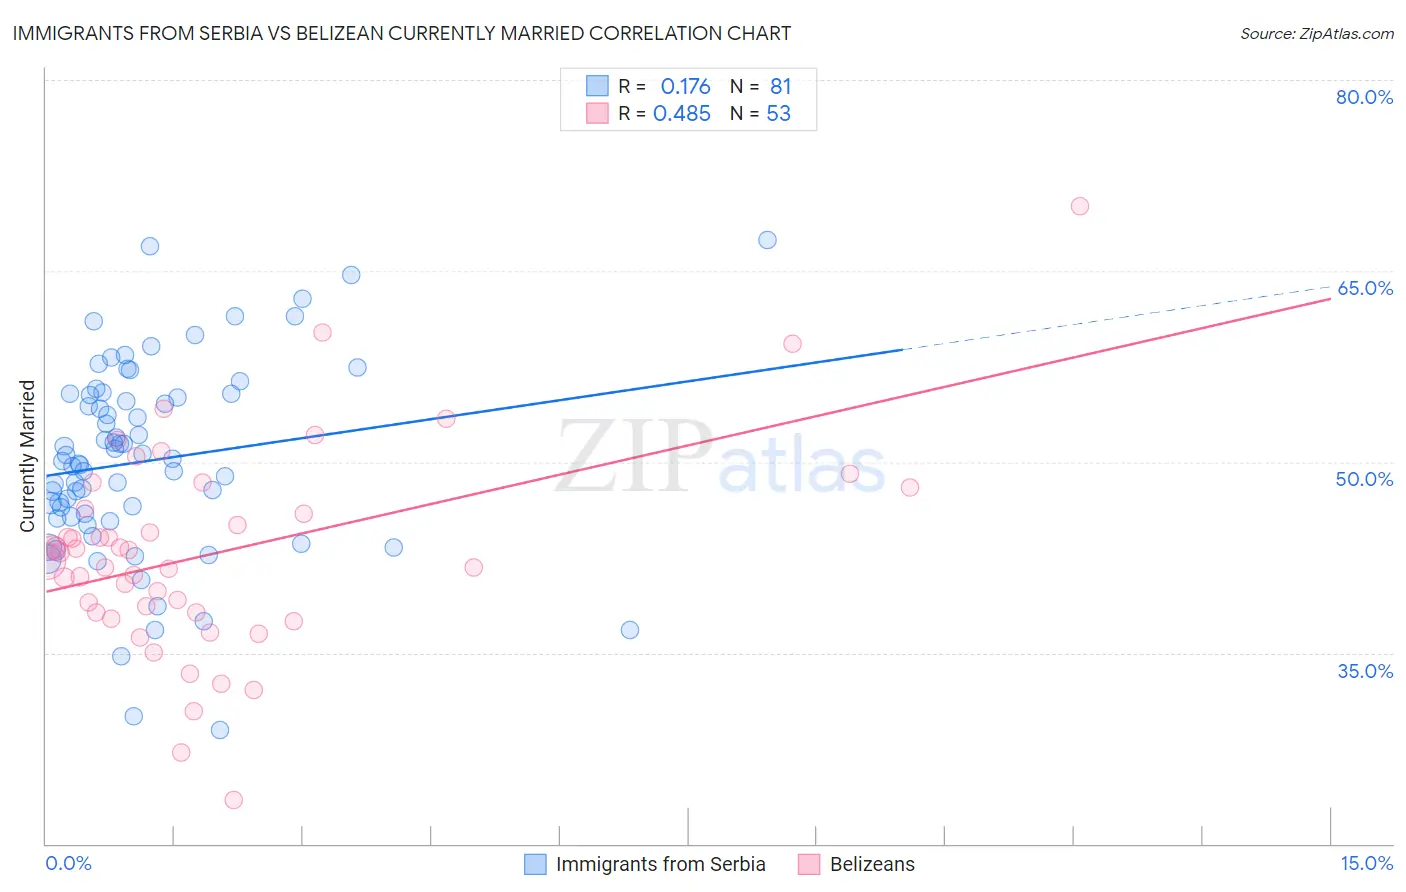
Immigrants from Serbia vs Belizean Currently Married Correlation Chart
The statistical analysis conducted on geographies consisting of 131,746,050 people shows a poor positive correlation between the proportion of Immigrants from Serbia and percentage of population currently married in the United States with a correlation coefficient (R) of 0.176 and weighted average of 47.0%. Similarly, the statistical analysis conducted on geographies consisting of 144,212,972 people shows a moderate positive correlation between the proportion of Belizeans and percentage of population currently married in the United States with a correlation coefficient (R) of 0.485 and weighted average of 42.2%, a difference of 11.4%.
Currently Married Correlation Summary
| Measurement | Immigrants from Serbia | Belizean |
| Minimum | 28.9% | 23.5% |
| Maximum | 67.4% | 70.1% |
| Range | 38.5% | 46.6% |
| Mean | 50.1% | 42.9% |
| Median | 50.1% | 42.8% |
| Interquartile 25% (IQ1) | 45.6% | 38.2% |
| Interquartile 75% (IQ3) | 55.3% | 47.1% |
| Interquartile Range (IQR) | 9.7% | 9.0% |
| Standard Deviation (Sample) | 7.6% | 8.1% |
| Standard Deviation (Population) | 7.6% | 8.1% |
Similar Demographics by Currently Married
Demographics Similar to Immigrants from Serbia by Currently Married
In terms of currently married, the demographic groups most similar to Immigrants from Serbia are Immigrants from Venezuela (47.0%, a difference of 0.010%), Albanian (47.0%, a difference of 0.010%), Arab (47.0%, a difference of 0.010%), Spanish (47.0%, a difference of 0.030%), and Chilean (47.0%, a difference of 0.040%).
| Demographics | Rating | Rank | Currently Married |
| Immigrants | South Eastern Asia | 72.9 /100 | #145 | Good 47.1% |
| Carpatho Rusyns | 72.6 /100 | #146 | Good 47.0% |
| Immigrants | Argentina | 72.0 /100 | #147 | Good 47.0% |
| Cambodians | 70.4 /100 | #148 | Good 47.0% |
| Zimbabweans | 70.1 /100 | #149 | Good 47.0% |
| Immigrants | Turkey | 70.0 /100 | #150 | Good 47.0% |
| Chileans | 69.8 /100 | #151 | Good 47.0% |
| Immigrants | Serbia | 68.8 /100 | #152 | Good 47.0% |
| Immigrants | Venezuela | 68.6 /100 | #153 | Good 47.0% |
| Albanians | 68.6 /100 | #154 | Good 47.0% |
| Arabs | 68.6 /100 | #155 | Good 47.0% |
| Spanish | 68.1 /100 | #156 | Good 47.0% |
| Immigrants | Switzerland | 67.8 /100 | #157 | Good 46.9% |
| Cherokee | 66.8 /100 | #158 | Good 46.9% |
| Iraqis | 66.4 /100 | #159 | Good 46.9% |
Demographics Similar to Belizeans by Currently Married
In terms of currently married, the demographic groups most similar to Belizeans are Liberian (42.2%, a difference of 0.10%), Immigrants from Honduras (42.2%, a difference of 0.13%), Cheyenne (42.2%, a difference of 0.22%), Immigrants from Yemen (42.1%, a difference of 0.24%), and Menominee (42.3%, a difference of 0.33%).
| Demographics | Rating | Rank | Currently Married |
| Yuman | 0.0 /100 | #293 | Tragic 42.6% |
| Hondurans | 0.0 /100 | #294 | Tragic 42.5% |
| Immigrants | Western Africa | 0.0 /100 | #295 | Tragic 42.4% |
| Menominee | 0.0 /100 | #296 | Tragic 42.3% |
| Cheyenne | 0.0 /100 | #297 | Tragic 42.2% |
| Immigrants | Honduras | 0.0 /100 | #298 | Tragic 42.2% |
| Liberians | 0.0 /100 | #299 | Tragic 42.2% |
| Belizeans | 0.0 /100 | #300 | Tragic 42.2% |
| Immigrants | Yemen | 0.0 /100 | #301 | Tragic 42.1% |
| Immigrants | Zaire | 0.0 /100 | #302 | Tragic 42.0% |
| Sioux | 0.0 /100 | #303 | Tragic 41.9% |
| Immigrants | Bahamas | 0.0 /100 | #304 | Tragic 41.9% |
| Immigrants | Trinidad and Tobago | 0.0 /100 | #305 | Tragic 41.9% |
| Immigrants | Guyana | 0.0 /100 | #306 | Tragic 41.9% |
| Africans | 0.0 /100 | #307 | Tragic 41.8% |