Immigrants from Senegal vs Welsh Currently Married
COMPARE
Immigrants from Senegal
Welsh
Currently Married
Currently Married Comparison
Immigrants from Senegal
Welsh
40.7%
CURRENTLY MARRIED
0.0/ 100
METRIC RATING
324th/ 347
METRIC RANK
48.9%
CURRENTLY MARRIED
99.5/ 100
METRIC RATING
28th/ 347
METRIC RANK
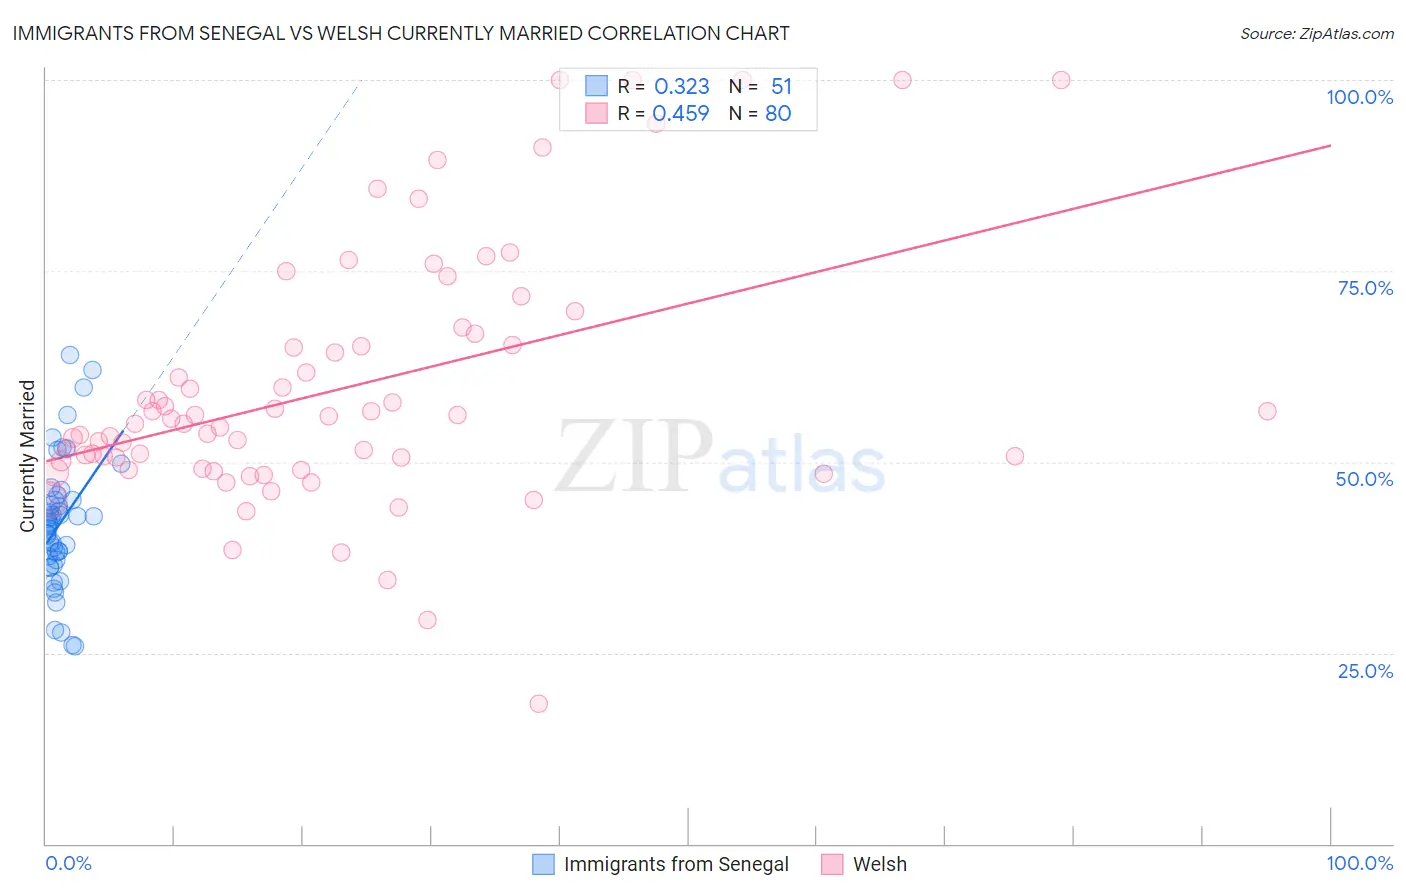
Immigrants from Senegal vs Welsh Currently Married Correlation Chart
The statistical analysis conducted on geographies consisting of 90,127,337 people shows a mild positive correlation between the proportion of Immigrants from Senegal and percentage of population currently married in the United States with a correlation coefficient (R) of 0.323 and weighted average of 40.7%. Similarly, the statistical analysis conducted on geographies consisting of 528,516,985 people shows a moderate positive correlation between the proportion of Welsh and percentage of population currently married in the United States with a correlation coefficient (R) of 0.459 and weighted average of 48.9%, a difference of 20.2%.
Currently Married Correlation Summary
| Measurement | Immigrants from Senegal | Welsh |
| Minimum | 25.8% | 18.4% |
| Maximum | 64.1% | 100.0% |
| Range | 38.3% | 81.6% |
| Mean | 41.9% | 59.7% |
| Median | 42.0% | 55.4% |
| Interquartile 25% (IQ1) | 37.2% | 49.6% |
| Interquartile 75% (IQ3) | 45.0% | 66.0% |
| Interquartile Range (IQR) | 7.8% | 16.4% |
| Standard Deviation (Sample) | 8.3% | 16.8% |
| Standard Deviation (Population) | 8.3% | 16.7% |
Similar Demographics by Currently Married
Demographics Similar to Immigrants from Senegal by Currently Married
In terms of currently married, the demographic groups most similar to Immigrants from Senegal are Immigrants from West Indies (40.7%, a difference of 0.010%), U.S. Virgin Islander (40.7%, a difference of 0.050%), Barbadian (40.6%, a difference of 0.19%), Senegalese (40.6%, a difference of 0.36%), and Arapaho (40.5%, a difference of 0.40%).
| Demographics | Rating | Rank | Currently Married |
| Haitians | 0.0 /100 | #317 | Tragic 41.3% |
| Bahamians | 0.0 /100 | #318 | Tragic 41.2% |
| Immigrants | Somalia | 0.0 /100 | #319 | Tragic 41.2% |
| Immigrants | Jamaica | 0.0 /100 | #320 | Tragic 41.1% |
| Immigrants | Congo | 0.0 /100 | #321 | Tragic 41.1% |
| Immigrants | Haiti | 0.0 /100 | #322 | Tragic 41.0% |
| Immigrants | West Indies | 0.0 /100 | #323 | Tragic 40.7% |
| Immigrants | Senegal | 0.0 /100 | #324 | Tragic 40.7% |
| U.S. Virgin Islanders | 0.0 /100 | #325 | Tragic 40.7% |
| Barbadians | 0.0 /100 | #326 | Tragic 40.6% |
| Senegalese | 0.0 /100 | #327 | Tragic 40.6% |
| Arapaho | 0.0 /100 | #328 | Tragic 40.5% |
| Crow | 0.0 /100 | #329 | Tragic 40.4% |
| Immigrants | Dominica | 0.0 /100 | #330 | Tragic 40.3% |
| Immigrants | Barbados | 0.0 /100 | #331 | Tragic 40.3% |
Demographics Similar to Welsh by Currently Married
In terms of currently married, the demographic groups most similar to Welsh are Burmese (48.9%, a difference of 0.040%), Croatian (48.9%, a difference of 0.050%), Eastern European (48.9%, a difference of 0.060%), Polish (48.9%, a difference of 0.060%), and Immigrants from Hong Kong (48.9%, a difference of 0.070%).
| Demographics | Rating | Rank | Currently Married |
| Scottish | 99.8 /100 | #21 | Exceptional 49.2% |
| Bulgarians | 99.7 /100 | #22 | Exceptional 49.1% |
| Immigrants | Pakistan | 99.7 /100 | #23 | Exceptional 49.1% |
| Lithuanians | 99.6 /100 | #24 | Exceptional 49.0% |
| Maltese | 99.6 /100 | #25 | Exceptional 49.0% |
| Immigrants | Korea | 99.6 /100 | #26 | Exceptional 49.0% |
| Burmese | 99.6 /100 | #27 | Exceptional 48.9% |
| Welsh | 99.5 /100 | #28 | Exceptional 48.9% |
| Croatians | 99.5 /100 | #29 | Exceptional 48.9% |
| Eastern Europeans | 99.5 /100 | #30 | Exceptional 48.9% |
| Poles | 99.5 /100 | #31 | Exceptional 48.9% |
| Immigrants | Hong Kong | 99.5 /100 | #32 | Exceptional 48.9% |
| Irish | 99.5 /100 | #33 | Exceptional 48.9% |
| Immigrants | Lithuania | 99.4 /100 | #34 | Exceptional 48.8% |
| Immigrants | Northern Europe | 99.4 /100 | #35 | Exceptional 48.8% |