Immigrants from Senegal vs Immigrants from Northern Africa Single Father Households
COMPARE
Immigrants from Senegal
Immigrants from Northern Africa
Single Father Households
Single Father Households Comparison
Immigrants from Senegal
Immigrants from Northern Africa
2.3%
SINGLE FATHER HOUSEHOLDS
79.4/ 100
METRIC RATING
158th/ 347
METRIC RANK
2.1%
SINGLE FATHER HOUSEHOLDS
99.0/ 100
METRIC RATING
100th/ 347
METRIC RANK
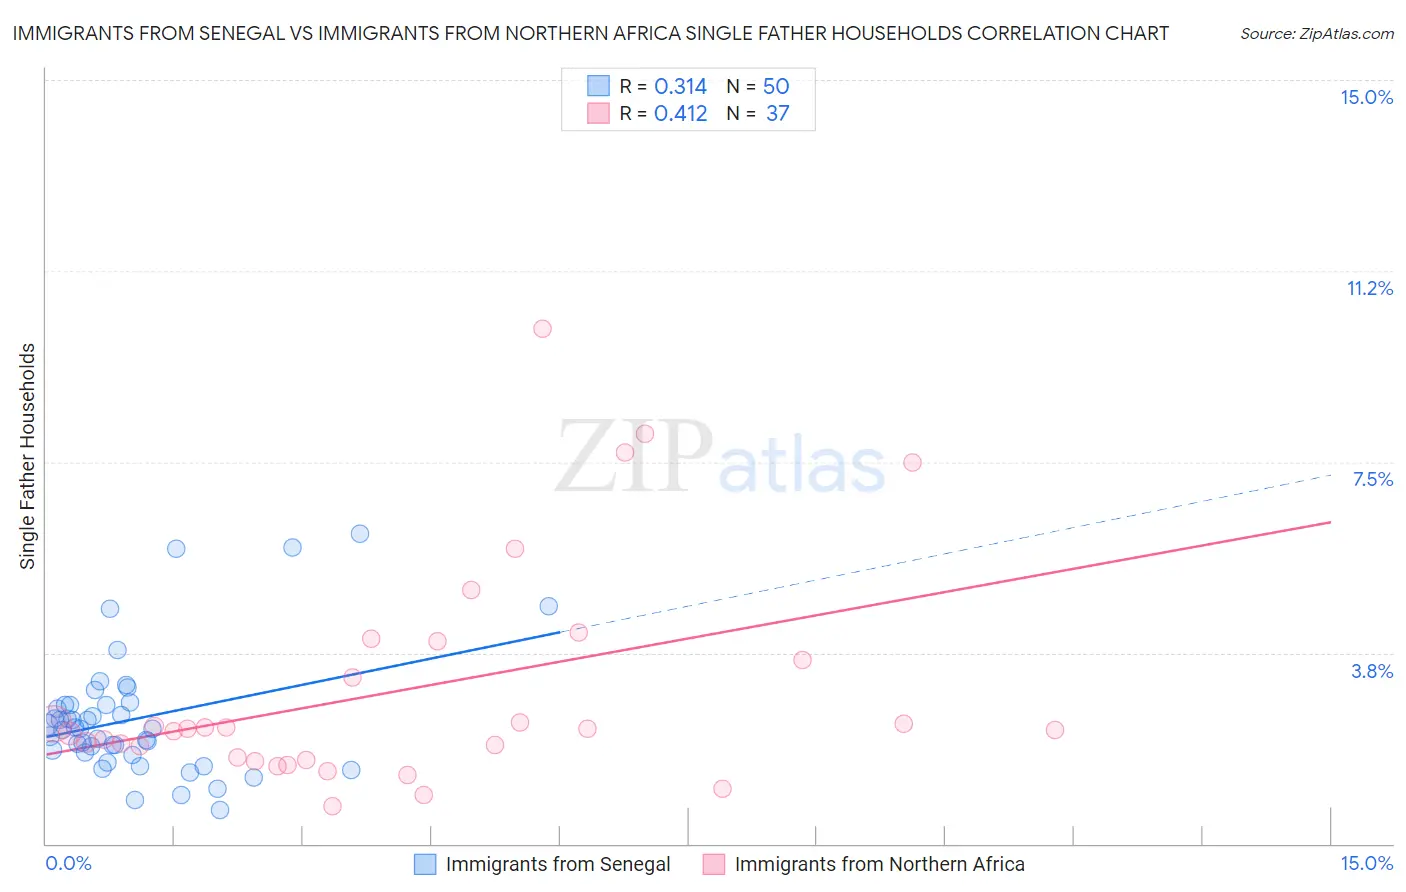
Immigrants from Senegal vs Immigrants from Northern Africa Single Father Households Correlation Chart
The statistical analysis conducted on geographies consisting of 90,010,834 people shows a mild positive correlation between the proportion of Immigrants from Senegal and percentage of single father households in the United States with a correlation coefficient (R) of 0.314 and weighted average of 2.3%. Similarly, the statistical analysis conducted on geographies consisting of 319,229,485 people shows a moderate positive correlation between the proportion of Immigrants from Northern Africa and percentage of single father households in the United States with a correlation coefficient (R) of 0.412 and weighted average of 2.1%, a difference of 6.5%.
Single Father Households Correlation Summary
| Measurement | Immigrants from Senegal | Immigrants from Northern Africa |
| Minimum | 0.67% | 0.74% |
| Maximum | 6.1% | 10.1% |
| Range | 5.4% | 9.4% |
| Mean | 2.5% | 3.0% |
| Median | 2.3% | 2.3% |
| Interquartile 25% (IQ1) | 1.8% | 1.7% |
| Interquartile 75% (IQ3) | 2.7% | 3.8% |
| Interquartile Range (IQR) | 0.93% | 2.1% |
| Standard Deviation (Sample) | 1.2% | 2.2% |
| Standard Deviation (Population) | 1.2% | 2.2% |
Similar Demographics by Single Father Households
Demographics Similar to Immigrants from Senegal by Single Father Households
In terms of single father households, the demographic groups most similar to Immigrants from Senegal are Canadian (2.3%, a difference of 0.030%), Immigrants from South America (2.3%, a difference of 0.050%), European (2.3%, a difference of 0.17%), Immigrants from West Indies (2.3%, a difference of 0.17%), and Bolivian (2.3%, a difference of 0.19%).
| Demographics | Rating | Rank | Single Father Households |
| Immigrants | Syria | 84.8 /100 | #151 | Excellent 2.3% |
| Immigrants | Venezuela | 83.2 /100 | #152 | Excellent 2.3% |
| Immigrants | Germany | 82.8 /100 | #153 | Excellent 2.3% |
| Bolivians | 81.0 /100 | #154 | Excellent 2.3% |
| Europeans | 80.9 /100 | #155 | Excellent 2.3% |
| Immigrants | South America | 79.9 /100 | #156 | Good 2.3% |
| Canadians | 79.7 /100 | #157 | Good 2.3% |
| Immigrants | Senegal | 79.4 /100 | #158 | Good 2.3% |
| Immigrants | West Indies | 77.9 /100 | #159 | Good 2.3% |
| Immigrants | Bolivia | 76.3 /100 | #160 | Good 2.3% |
| Swiss | 73.2 /100 | #161 | Good 2.3% |
| Scottish | 72.8 /100 | #162 | Good 2.3% |
| Irish | 72.1 /100 | #163 | Good 2.3% |
| Pakistanis | 70.6 /100 | #164 | Good 2.3% |
| Scotch-Irish | 69.4 /100 | #165 | Good 2.3% |
Demographics Similar to Immigrants from Northern Africa by Single Father Households
In terms of single father households, the demographic groups most similar to Immigrants from Northern Africa are South African (2.1%, a difference of 0.15%), Immigrants from Western Europe (2.1%, a difference of 0.15%), Argentinean (2.1%, a difference of 0.18%), Guyanese (2.1%, a difference of 0.19%), and Lebanese (2.1%, a difference of 0.20%).
| Demographics | Rating | Rank | Single Father Households |
| Croatians | 99.3 /100 | #93 | Exceptional 2.1% |
| Ukrainians | 99.3 /100 | #94 | Exceptional 2.1% |
| Bermudans | 99.2 /100 | #95 | Exceptional 2.1% |
| Arabs | 99.2 /100 | #96 | Exceptional 2.1% |
| Immigrants | Moldova | 99.1 /100 | #97 | Exceptional 2.1% |
| Guyanese | 99.1 /100 | #98 | Exceptional 2.1% |
| South Africans | 99.1 /100 | #99 | Exceptional 2.1% |
| Immigrants | Northern Africa | 99.0 /100 | #100 | Exceptional 2.1% |
| Immigrants | Western Europe | 98.9 /100 | #101 | Exceptional 2.1% |
| Argentineans | 98.9 /100 | #102 | Exceptional 2.1% |
| Lebanese | 98.9 /100 | #103 | Exceptional 2.1% |
| Alsatians | 98.9 /100 | #104 | Exceptional 2.1% |
| Palestinians | 98.6 /100 | #105 | Exceptional 2.2% |
| Immigrants | Southern Europe | 98.6 /100 | #106 | Exceptional 2.2% |
| Slovenes | 98.5 /100 | #107 | Exceptional 2.2% |