Immigrants from Senegal vs Black/African American Family Households with Children
COMPARE
Immigrants from Senegal
Black/African American
Family Households with Children
Family Households with Children Comparison
Immigrants from Senegal
Blacks/African Americans
26.5%
FAMILY HOUSEHOLDS WITH CHILDREN
0.2/ 100
METRIC RATING
286th/ 347
METRIC RANK
26.5%
FAMILY HOUSEHOLDS WITH CHILDREN
0.1/ 100
METRIC RATING
293rd/ 347
METRIC RANK
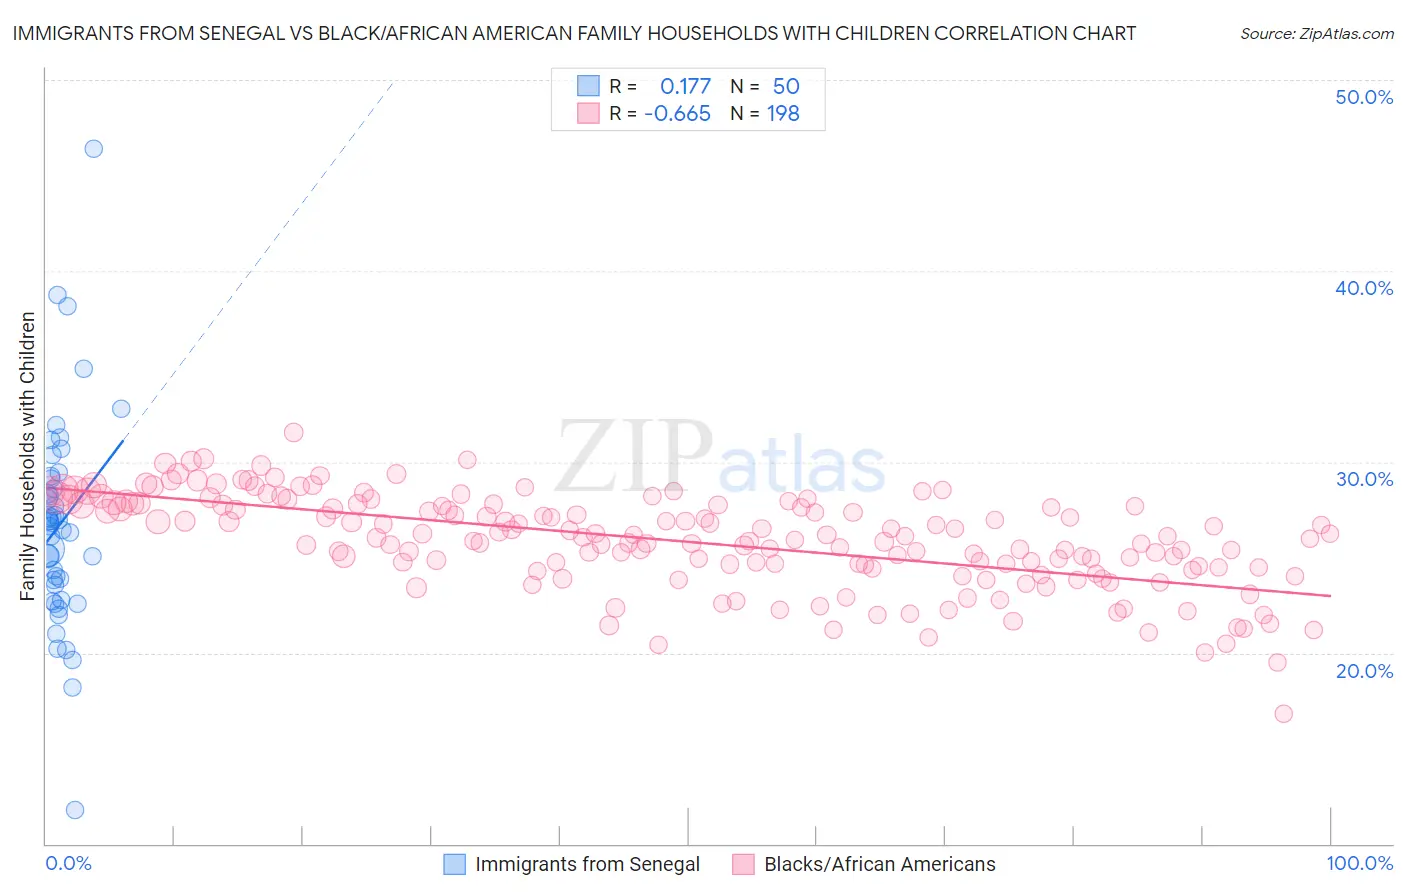
Immigrants from Senegal vs Black/African American Family Households with Children Correlation Chart
The statistical analysis conducted on geographies consisting of 90,108,682 people shows a poor positive correlation between the proportion of Immigrants from Senegal and percentage of family households with children in the United States with a correlation coefficient (R) of 0.177 and weighted average of 26.5%. Similarly, the statistical analysis conducted on geographies consisting of 564,937,994 people shows a significant negative correlation between the proportion of Blacks/African Americans and percentage of family households with children in the United States with a correlation coefficient (R) of -0.665 and weighted average of 26.5%, a difference of 0.24%.
Family Households with Children Correlation Summary
| Measurement | Immigrants from Senegal | Black/African American |
| Minimum | 11.8% | 16.8% |
| Maximum | 46.4% | 31.5% |
| Range | 34.6% | 14.7% |
| Mean | 26.7% | 25.8% |
| Median | 26.8% | 26.0% |
| Interquartile 25% (IQ1) | 23.6% | 24.5% |
| Interquartile 75% (IQ3) | 29.1% | 27.7% |
| Interquartile Range (IQR) | 5.6% | 3.2% |
| Standard Deviation (Sample) | 5.6% | 2.5% |
| Standard Deviation (Population) | 5.5% | 2.4% |
Demographics Similar to Immigrants from Senegal and Blacks/African Americans by Family Households with Children
In terms of family households with children, the demographic groups most similar to Immigrants from Senegal are Shoshone (26.5%, a difference of 0.0%), Russian (26.5%, a difference of 0.020%), Cambodian (26.5%, a difference of 0.050%), Immigrants from Sweden (26.5%, a difference of 0.070%), and Immigrants from Canada (26.5%, a difference of 0.080%). Similarly, the demographic groups most similar to Blacks/African Americans are Polish (26.5%, a difference of 0.050%), Albanian (26.5%, a difference of 0.060%), Bahamian (26.5%, a difference of 0.060%), Latvian (26.4%, a difference of 0.060%), and Macedonian (26.4%, a difference of 0.13%).
| Demographics | Rating | Rank | Family Households with Children |
| Finns | 0.4 /100 | #279 | Tragic 26.6% |
| Senegalese | 0.4 /100 | #280 | Tragic 26.6% |
| Lithuanians | 0.3 /100 | #281 | Tragic 26.6% |
| French American Indians | 0.3 /100 | #282 | Tragic 26.6% |
| Immigrants | North America | 0.3 /100 | #283 | Tragic 26.6% |
| Immigrants | Canada | 0.3 /100 | #284 | Tragic 26.5% |
| Cambodians | 0.2 /100 | #285 | Tragic 26.5% |
| Immigrants | Senegal | 0.2 /100 | #286 | Tragic 26.5% |
| Shoshone | 0.2 /100 | #287 | Tragic 26.5% |
| Russians | 0.2 /100 | #288 | Tragic 26.5% |
| Immigrants | Sweden | 0.2 /100 | #289 | Tragic 26.5% |
| Albanians | 0.2 /100 | #290 | Tragic 26.5% |
| Bahamians | 0.2 /100 | #291 | Tragic 26.5% |
| Poles | 0.2 /100 | #292 | Tragic 26.5% |
| Blacks/African Americans | 0.1 /100 | #293 | Tragic 26.5% |
| Latvians | 0.1 /100 | #294 | Tragic 26.4% |
| Macedonians | 0.1 /100 | #295 | Tragic 26.4% |
| Croatians | 0.1 /100 | #296 | Tragic 26.4% |
| Armenians | 0.1 /100 | #297 | Tragic 26.4% |
| Immigrants | Western Europe | 0.1 /100 | #298 | Tragic 26.4% |
| Trinidadians and Tobagonians | 0.1 /100 | #299 | Tragic 26.4% |