Immigrants from Romania vs Immigrants from Cambodia Average Family Size
COMPARE
Immigrants from Romania
Immigrants from Cambodia
Average Family Size
Average Family Size Comparison
Immigrants from Romania
Immigrants from Cambodia
3.18
AVERAGE FAMILY SIZE
3.7/ 100
METRIC RATING
237th/ 347
METRIC RANK
3.33
AVERAGE FAMILY SIZE
99.9/ 100
METRIC RATING
68th/ 347
METRIC RANK
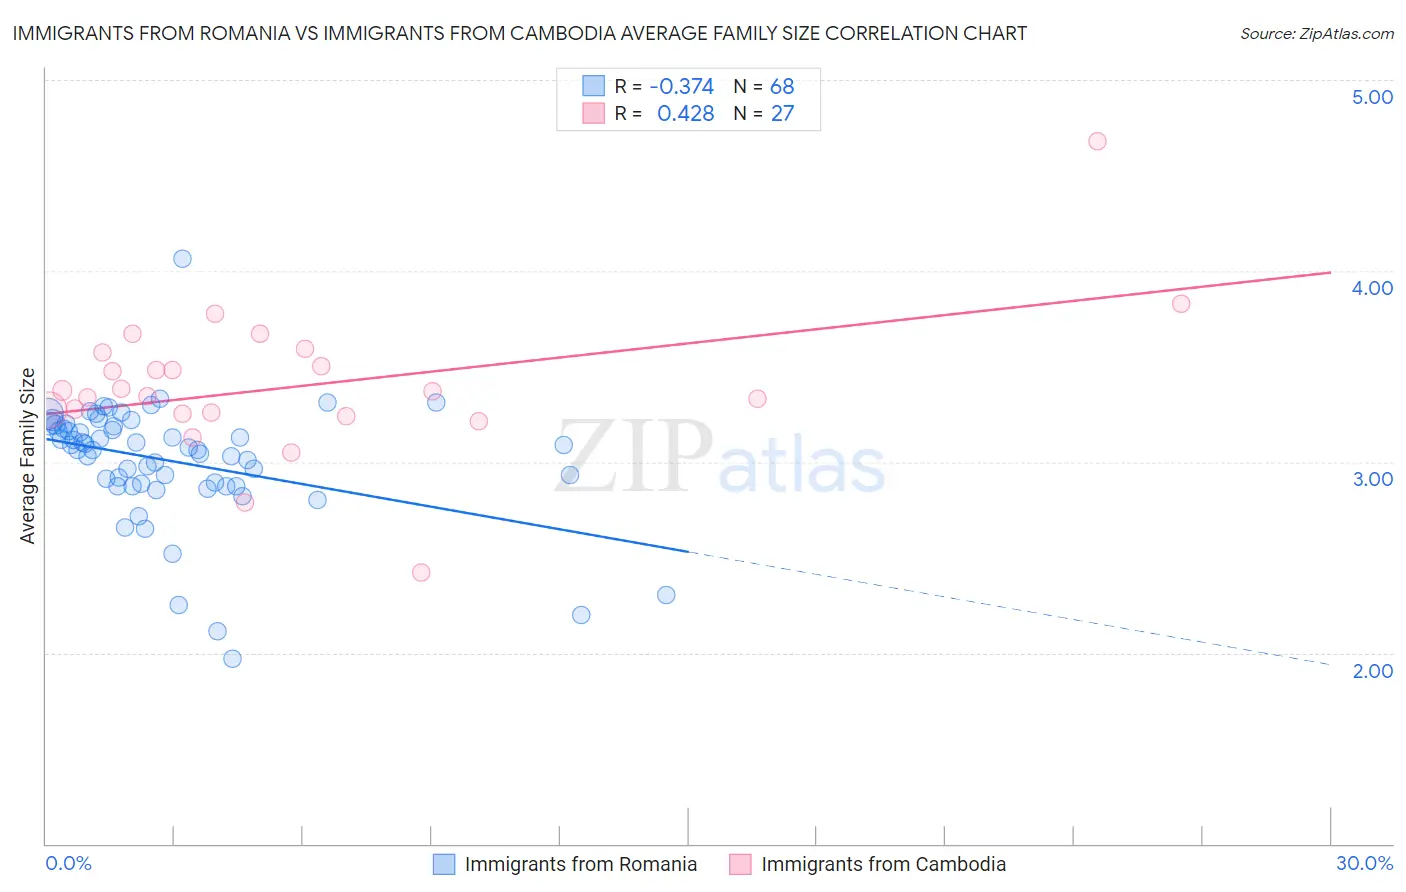
Immigrants from Romania vs Immigrants from Cambodia Average Family Size Correlation Chart
The statistical analysis conducted on geographies consisting of 256,963,542 people shows a mild negative correlation between the proportion of Immigrants from Romania and average family size in the United States with a correlation coefficient (R) of -0.374 and weighted average of 3.18. Similarly, the statistical analysis conducted on geographies consisting of 205,129,465 people shows a moderate positive correlation between the proportion of Immigrants from Cambodia and average family size in the United States with a correlation coefficient (R) of 0.428 and weighted average of 3.33, a difference of 4.7%.
Average Family Size Correlation Summary
| Measurement | Immigrants from Romania | Immigrants from Cambodia |
| Minimum | 1.97 | 2.42 |
| Maximum | 4.06 | 4.68 |
| Range | 2.09 | 2.26 |
| Mean | 3.00 | 3.40 |
| Median | 3.07 | 3.37 |
| Interquartile 25% (IQ1) | 2.88 | 3.25 |
| Interquartile 75% (IQ3) | 3.19 | 3.57 |
| Interquartile Range (IQR) | 0.31 | 0.32 |
| Standard Deviation (Sample) | 0.32 | 0.39 |
| Standard Deviation (Population) | 0.32 | 0.38 |
Similar Demographics by Average Family Size
Demographics Similar to Immigrants from Romania by Average Family Size
In terms of average family size, the demographic groups most similar to Immigrants from Romania are Romanian (3.18, a difference of 0.0%), Immigrants from Portugal (3.18, a difference of 0.050%), Houma (3.18, a difference of 0.050%), Immigrants from Turkey (3.18, a difference of 0.060%), and Osage (3.18, a difference of 0.070%).
| Demographics | Rating | Rank | Average Family Size |
| Icelanders | 5.2 /100 | #230 | Tragic 3.19 |
| Basques | 5.2 /100 | #231 | Tragic 3.19 |
| Cherokee | 4.7 /100 | #232 | Tragic 3.18 |
| Brazilians | 4.5 /100 | #233 | Tragic 3.18 |
| Iranians | 4.5 /100 | #234 | Tragic 3.18 |
| Immigrants | Turkey | 4.2 /100 | #235 | Tragic 3.18 |
| Immigrants | Portugal | 4.2 /100 | #236 | Tragic 3.18 |
| Immigrants | Romania | 3.7 /100 | #237 | Tragic 3.18 |
| Romanians | 3.7 /100 | #238 | Tragic 3.18 |
| Houma | 3.4 /100 | #239 | Tragic 3.18 |
| Osage | 3.2 /100 | #240 | Tragic 3.18 |
| Immigrants | Japan | 3.0 /100 | #241 | Tragic 3.18 |
| Hungarians | 3.0 /100 | #242 | Tragic 3.18 |
| Immigrants | Moldova | 2.9 /100 | #243 | Tragic 3.18 |
| Immigrants | Southern Europe | 2.9 /100 | #244 | Tragic 3.18 |
Demographics Similar to Immigrants from Cambodia by Average Family Size
In terms of average family size, the demographic groups most similar to Immigrants from Cambodia are Immigrants (3.33, a difference of 0.030%), Immigrants from Jamaica (3.33, a difference of 0.080%), Immigrants from Trinidad and Tobago (3.33, a difference of 0.080%), Immigrants from West Indies (3.33, a difference of 0.090%), and Immigrants from St. Vincent and the Grenadines (3.34, a difference of 0.12%).
| Demographics | Rating | Rank | Average Family Size |
| Central American Indians | 100.0 /100 | #61 | Exceptional 3.35 |
| Immigrants | Grenada | 100.0 /100 | #62 | Exceptional 3.34 |
| Chinese | 100.0 /100 | #63 | Exceptional 3.34 |
| Dominicans | 99.9 /100 | #64 | Exceptional 3.34 |
| Immigrants | Laos | 99.9 /100 | #65 | Exceptional 3.34 |
| Immigrants | St. Vincent and the Grenadines | 99.9 /100 | #66 | Exceptional 3.34 |
| Immigrants | Jamaica | 99.9 /100 | #67 | Exceptional 3.33 |
| Immigrants | Cambodia | 99.9 /100 | #68 | Exceptional 3.33 |
| Immigrants | Immigrants | 99.9 /100 | #69 | Exceptional 3.33 |
| Immigrants | Trinidad and Tobago | 99.9 /100 | #70 | Exceptional 3.33 |
| Immigrants | West Indies | 99.9 /100 | #71 | Exceptional 3.33 |
| Immigrants | Caribbean | 99.9 /100 | #72 | Exceptional 3.33 |
| Yaqui | 99.9 /100 | #73 | Exceptional 3.32 |
| Immigrants | Sierra Leone | 99.9 /100 | #74 | Exceptional 3.32 |
| Immigrants | Barbados | 99.8 /100 | #75 | Exceptional 3.32 |