Immigrants from Portugal vs Native Hawaiian Divorced or Separated
COMPARE
Immigrants from Portugal
Native Hawaiian
Divorced or Separated
Divorced or Separated Comparison
Immigrants from Portugal
Native Hawaiians
11.9%
DIVORCED OR SEPARATED
77.3/ 100
METRIC RATING
150th/ 347
METRIC RANK
11.7%
DIVORCED OR SEPARATED
97.2/ 100
METRIC RATING
107th/ 347
METRIC RANK
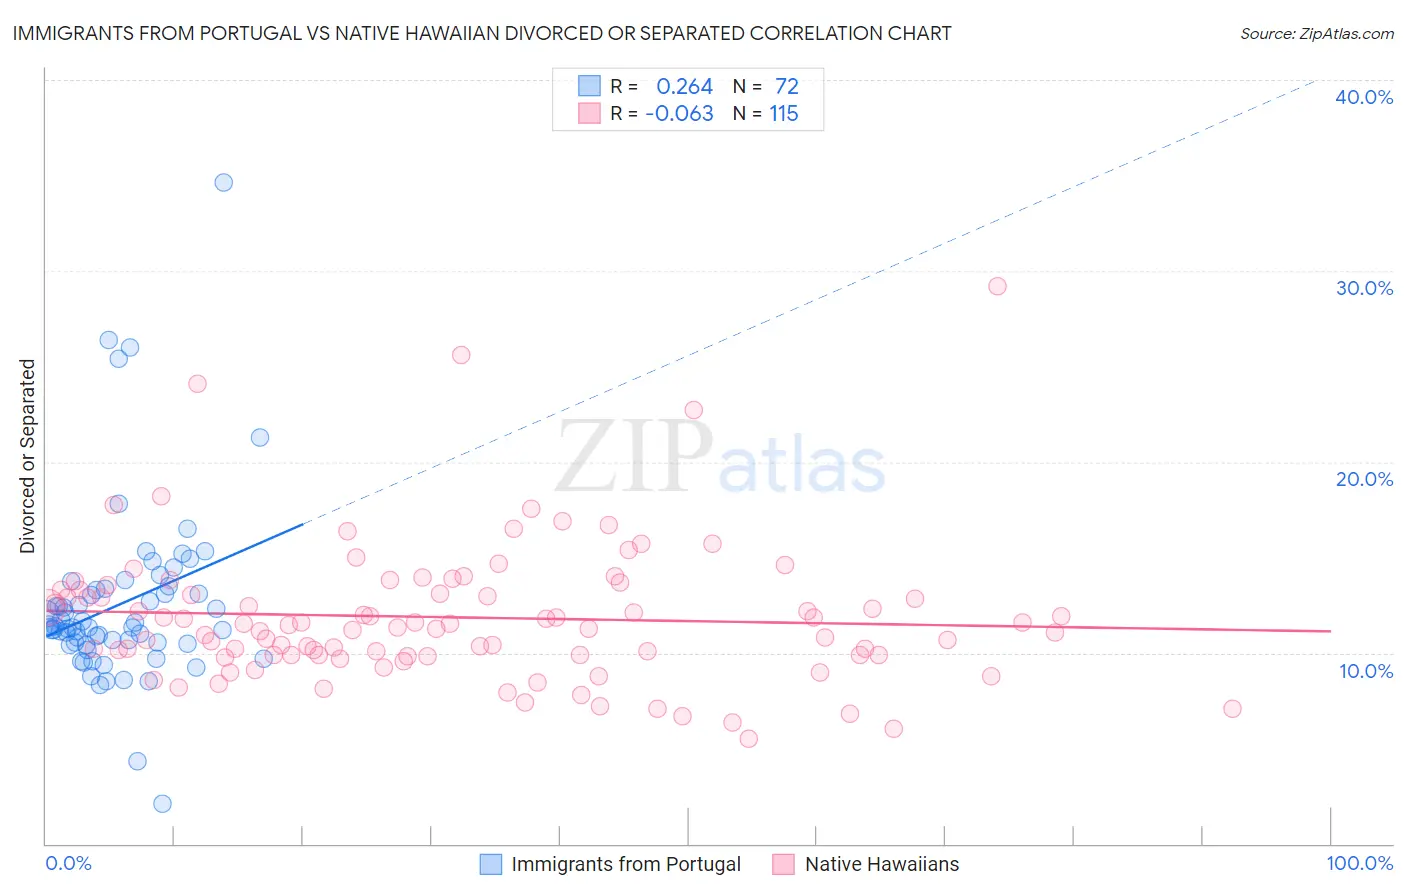
Immigrants from Portugal vs Native Hawaiian Divorced or Separated Correlation Chart
The statistical analysis conducted on geographies consisting of 174,784,799 people shows a weak positive correlation between the proportion of Immigrants from Portugal and percentage of population currently divorced or separated in the United States with a correlation coefficient (R) of 0.264 and weighted average of 11.9%. Similarly, the statistical analysis conducted on geographies consisting of 331,991,135 people shows a slight negative correlation between the proportion of Native Hawaiians and percentage of population currently divorced or separated in the United States with a correlation coefficient (R) of -0.063 and weighted average of 11.7%, a difference of 2.1%.
Divorced or Separated Correlation Summary
| Measurement | Immigrants from Portugal | Native Hawaiian |
| Minimum | 2.1% | 5.5% |
| Maximum | 34.6% | 29.2% |
| Range | 32.5% | 23.7% |
| Mean | 12.5% | 11.9% |
| Median | 11.3% | 11.3% |
| Interquartile 25% (IQ1) | 10.5% | 9.9% |
| Interquartile 75% (IQ3) | 13.3% | 13.3% |
| Interquartile Range (IQR) | 2.8% | 3.4% |
| Standard Deviation (Sample) | 4.7% | 3.7% |
| Standard Deviation (Population) | 4.7% | 3.7% |
Similar Demographics by Divorced or Separated
Demographics Similar to Immigrants from Portugal by Divorced or Separated
In terms of divorced or separated, the demographic groups most similar to Immigrants from Portugal are Immigrants from Oceania (11.9%, a difference of 0.020%), Italian (11.9%, a difference of 0.030%), Czech (11.9%, a difference of 0.040%), Polish (11.9%, a difference of 0.070%), and Immigrants from Grenada (11.9%, a difference of 0.090%).
| Demographics | Rating | Rank | Divorced or Separated |
| Pakistanis | 81.3 /100 | #143 | Excellent 11.9% |
| Peruvians | 80.9 /100 | #144 | Excellent 11.9% |
| Croatians | 80.6 /100 | #145 | Excellent 11.9% |
| Immigrants | Grenada | 79.1 /100 | #146 | Good 11.9% |
| Poles | 78.6 /100 | #147 | Good 11.9% |
| Italians | 77.8 /100 | #148 | Good 11.9% |
| Immigrants | Oceania | 77.7 /100 | #149 | Good 11.9% |
| Immigrants | Portugal | 77.3 /100 | #150 | Good 11.9% |
| Czechs | 76.4 /100 | #151 | Good 11.9% |
| Immigrants | Hungary | 73.7 /100 | #152 | Good 11.9% |
| Austrians | 72.2 /100 | #153 | Good 12.0% |
| Chileans | 71.3 /100 | #154 | Good 12.0% |
| Japanese | 70.9 /100 | #155 | Good 12.0% |
| Hungarians | 70.3 /100 | #156 | Good 12.0% |
| Immigrants | Brazil | 68.8 /100 | #157 | Good 12.0% |
Demographics Similar to Native Hawaiians by Divorced or Separated
In terms of divorced or separated, the demographic groups most similar to Native Hawaiians are Greek (11.7%, a difference of 0.090%), Immigrants from South Africa (11.7%, a difference of 0.10%), Immigrants from Czechoslovakia (11.7%, a difference of 0.10%), Immigrants from Spain (11.7%, a difference of 0.14%), and Immigrants from France (11.7%, a difference of 0.19%).
| Demographics | Rating | Rank | Divorced or Separated |
| Immigrants | Northern Europe | 98.6 /100 | #100 | Exceptional 11.6% |
| Immigrants | Guyana | 98.5 /100 | #101 | Exceptional 11.6% |
| Immigrants | Croatia | 98.3 /100 | #102 | Exceptional 11.6% |
| Maltese | 98.2 /100 | #103 | Exceptional 11.6% |
| Salvadorans | 98.2 /100 | #104 | Exceptional 11.6% |
| Immigrants | El Salvador | 97.9 /100 | #105 | Exceptional 11.7% |
| Immigrants | Kazakhstan | 97.8 /100 | #106 | Exceptional 11.7% |
| Native Hawaiians | 97.2 /100 | #107 | Exceptional 11.7% |
| Greeks | 96.9 /100 | #108 | Exceptional 11.7% |
| Immigrants | South Africa | 96.9 /100 | #109 | Exceptional 11.7% |
| Immigrants | Czechoslovakia | 96.9 /100 | #110 | Exceptional 11.7% |
| Immigrants | Spain | 96.8 /100 | #111 | Exceptional 11.7% |
| Immigrants | France | 96.6 /100 | #112 | Exceptional 11.7% |
| Estonians | 96.6 /100 | #113 | Exceptional 11.7% |
| Immigrants | Norway | 95.9 /100 | #114 | Exceptional 11.7% |