Immigrants from Philippines vs Immigrants from Korea Single Father Households
COMPARE
Immigrants from Philippines
Immigrants from Korea
Single Father Households
Single Father Households Comparison
Immigrants from Philippines
Immigrants from Korea
2.4%
SINGLE FATHER HOUSEHOLDS
28.7/ 100
METRIC RATING
195th/ 347
METRIC RANK
2.0%
SINGLE FATHER HOUSEHOLDS
99.9/ 100
METRIC RATING
54th/ 347
METRIC RANK
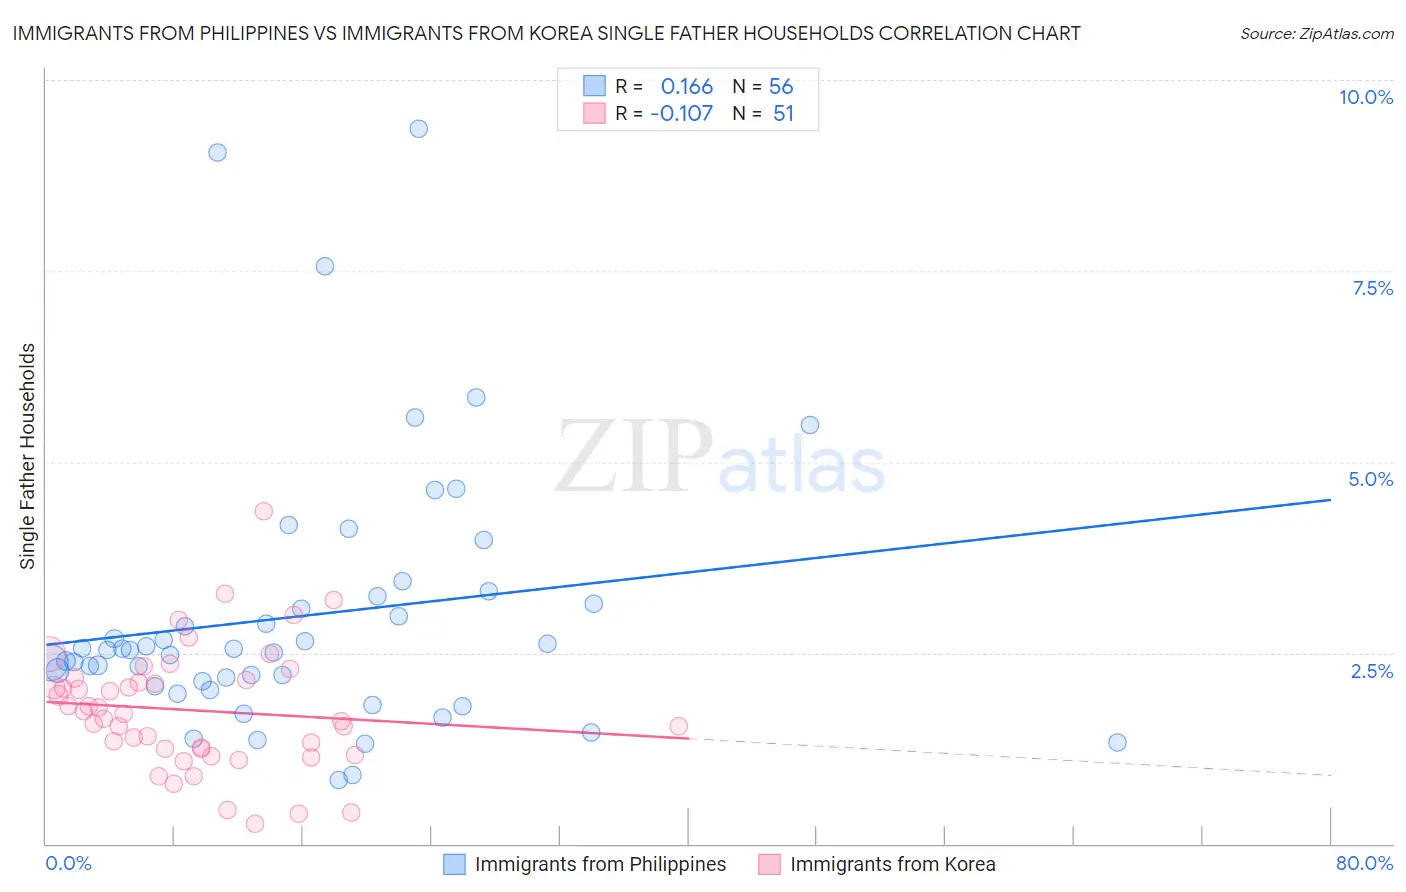
Immigrants from Philippines vs Immigrants from Korea Single Father Households Correlation Chart
The statistical analysis conducted on geographies consisting of 466,021,728 people shows a poor positive correlation between the proportion of Immigrants from Philippines and percentage of single father households in the United States with a correlation coefficient (R) of 0.166 and weighted average of 2.4%. Similarly, the statistical analysis conducted on geographies consisting of 412,362,512 people shows a poor negative correlation between the proportion of Immigrants from Korea and percentage of single father households in the United States with a correlation coefficient (R) of -0.107 and weighted average of 2.0%, a difference of 17.3%.
Single Father Households Correlation Summary
| Measurement | Immigrants from Philippines | Immigrants from Korea |
| Minimum | 0.84% | 0.27% |
| Maximum | 9.4% | 4.4% |
| Range | 8.5% | 4.1% |
| Mean | 3.0% | 1.7% |
| Median | 2.5% | 1.7% |
| Interquartile 25% (IQ1) | 2.1% | 1.2% |
| Interquartile 75% (IQ3) | 3.2% | 2.1% |
| Interquartile Range (IQR) | 1.1% | 0.91% |
| Standard Deviation (Sample) | 1.7% | 0.80% |
| Standard Deviation (Population) | 1.7% | 0.79% |
Similar Demographics by Single Father Households
Demographics Similar to Immigrants from Philippines by Single Father Households
In terms of single father households, the demographic groups most similar to Immigrants from Philippines are Kenyan (2.4%, a difference of 0.060%), German (2.4%, a difference of 0.060%), Panamanian (2.4%, a difference of 0.080%), Uruguayan (2.4%, a difference of 0.090%), and Immigrants from Sudan (2.4%, a difference of 0.10%).
| Demographics | Rating | Rank | Single Father Households |
| Hmong | 33.0 /100 | #188 | Fair 2.4% |
| U.S. Virgin Islanders | 31.8 /100 | #189 | Fair 2.4% |
| French | 31.7 /100 | #190 | Fair 2.4% |
| Immigrants | Africa | 30.0 /100 | #191 | Fair 2.4% |
| Immigrants | Sudan | 29.8 /100 | #192 | Fair 2.4% |
| Uruguayans | 29.7 /100 | #193 | Fair 2.4% |
| Panamanians | 29.6 /100 | #194 | Fair 2.4% |
| Immigrants | Philippines | 28.7 /100 | #195 | Fair 2.4% |
| Kenyans | 28.0 /100 | #196 | Fair 2.4% |
| Germans | 28.0 /100 | #197 | Fair 2.4% |
| Scandinavians | 27.4 /100 | #198 | Fair 2.4% |
| Immigrants | Vietnam | 27.1 /100 | #199 | Fair 2.4% |
| Peruvians | 27.1 /100 | #200 | Fair 2.4% |
| Immigrants | Uganda | 26.0 /100 | #201 | Fair 2.4% |
| German Russians | 25.7 /100 | #202 | Fair 2.4% |
Demographics Similar to Immigrants from Korea by Single Father Households
In terms of single father households, the demographic groups most similar to Immigrants from Korea are Immigrants from France (2.0%, a difference of 0.050%), Immigrants from Norway (2.0%, a difference of 0.080%), Immigrants from Northern Europe (2.0%, a difference of 0.14%), Immigrants from Europe (2.0%, a difference of 0.28%), and Burmese (2.0%, a difference of 0.34%).
| Demographics | Rating | Rank | Single Father Households |
| Immigrants | Ukraine | 99.9 /100 | #47 | Exceptional 2.0% |
| Immigrants | Kazakhstan | 99.9 /100 | #48 | Exceptional 2.0% |
| Immigrants | Serbia | 99.9 /100 | #49 | Exceptional 2.0% |
| Immigrants | Switzerland | 99.9 /100 | #50 | Exceptional 2.0% |
| Immigrants | Poland | 99.9 /100 | #51 | Exceptional 2.0% |
| Immigrants | Europe | 99.9 /100 | #52 | Exceptional 2.0% |
| Immigrants | Northern Europe | 99.9 /100 | #53 | Exceptional 2.0% |
| Immigrants | Korea | 99.9 /100 | #54 | Exceptional 2.0% |
| Immigrants | France | 99.9 /100 | #55 | Exceptional 2.0% |
| Immigrants | Norway | 99.9 /100 | #56 | Exceptional 2.0% |
| Burmese | 99.9 /100 | #57 | Exceptional 2.0% |
| Immigrants | Czechoslovakia | 99.9 /100 | #58 | Exceptional 2.0% |
| Immigrants | North Macedonia | 99.9 /100 | #59 | Exceptional 2.0% |
| Immigrants | Austria | 99.9 /100 | #60 | Exceptional 2.0% |
| Vietnamese | 99.9 /100 | #61 | Exceptional 2.0% |