Immigrants from Peru vs U.S. Virgin Islander Single Father Households
COMPARE
Immigrants from Peru
U.S. Virgin Islander
Single Father Households
Single Father Households Comparison
Immigrants from Peru
U.S. Virgin Islanders
2.4%
SINGLE FATHER HOUSEHOLDS
19.3/ 100
METRIC RATING
209th/ 347
METRIC RANK
2.4%
SINGLE FATHER HOUSEHOLDS
31.8/ 100
METRIC RATING
189th/ 347
METRIC RANK
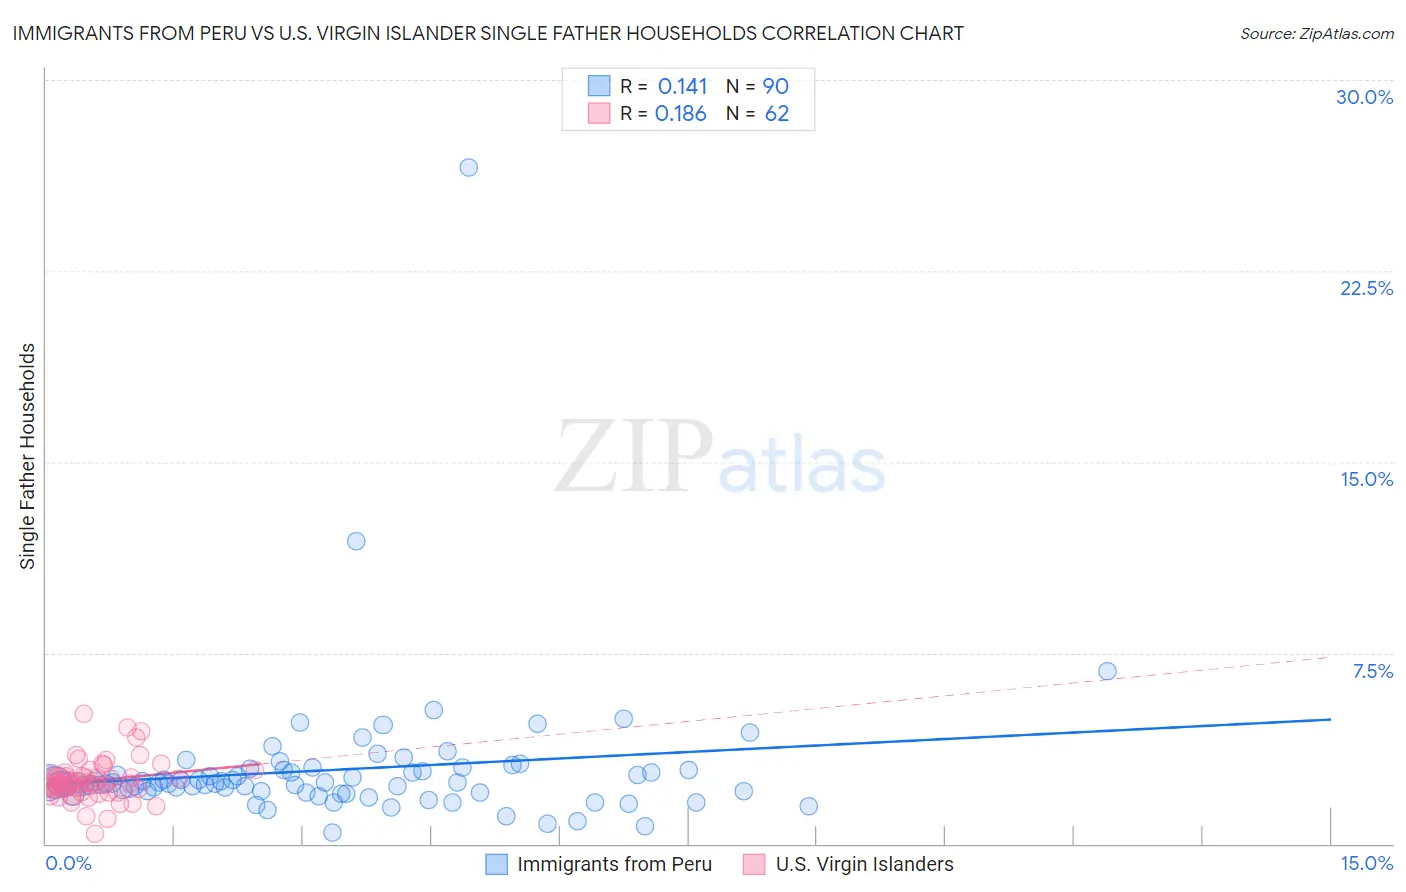
Immigrants from Peru vs U.S. Virgin Islander Single Father Households Correlation Chart
The statistical analysis conducted on geographies consisting of 326,923,065 people shows a poor positive correlation between the proportion of Immigrants from Peru and percentage of single father households in the United States with a correlation coefficient (R) of 0.141 and weighted average of 2.4%. Similarly, the statistical analysis conducted on geographies consisting of 87,373,145 people shows a poor positive correlation between the proportion of U.S. Virgin Islanders and percentage of single father households in the United States with a correlation coefficient (R) of 0.186 and weighted average of 2.4%, a difference of 1.2%.
Single Father Households Correlation Summary
| Measurement | Immigrants from Peru | U.S. Virgin Islander |
| Minimum | 0.45% | 0.38% |
| Maximum | 26.6% | 5.1% |
| Range | 26.1% | 4.7% |
| Mean | 2.9% | 2.5% |
| Median | 2.4% | 2.4% |
| Interquartile 25% (IQ1) | 2.0% | 2.1% |
| Interquartile 75% (IQ3) | 2.9% | 2.7% |
| Interquartile Range (IQR) | 0.84% | 0.57% |
| Standard Deviation (Sample) | 2.9% | 0.80% |
| Standard Deviation (Population) | 2.9% | 0.79% |
Demographics Similar to Immigrants from Peru and U.S. Virgin Islanders by Single Father Households
In terms of single father households, the demographic groups most similar to Immigrants from Peru are Immigrants from Kenya (2.4%, a difference of 0.12%), White/Caucasian (2.4%, a difference of 0.36%), Immigrants from Afghanistan (2.4%, a difference of 0.52%), Korean (2.4%, a difference of 0.52%), and Ecuadorian (2.4%, a difference of 0.55%). Similarly, the demographic groups most similar to U.S. Virgin Islanders are French (2.4%, a difference of 0.0%), Immigrants from Africa (2.4%, a difference of 0.15%), Immigrants from Sudan (2.4%, a difference of 0.17%), Uruguayan (2.4%, a difference of 0.18%), and Panamanian (2.4%, a difference of 0.18%).
| Demographics | Rating | Rank | Single Father Households |
| U.S. Virgin Islanders | 31.8 /100 | #189 | Fair 2.4% |
| French | 31.7 /100 | #190 | Fair 2.4% |
| Immigrants | Africa | 30.0 /100 | #191 | Fair 2.4% |
| Immigrants | Sudan | 29.8 /100 | #192 | Fair 2.4% |
| Uruguayans | 29.7 /100 | #193 | Fair 2.4% |
| Panamanians | 29.6 /100 | #194 | Fair 2.4% |
| Immigrants | Philippines | 28.7 /100 | #195 | Fair 2.4% |
| Kenyans | 28.0 /100 | #196 | Fair 2.4% |
| Germans | 28.0 /100 | #197 | Fair 2.4% |
| Scandinavians | 27.4 /100 | #198 | Fair 2.4% |
| Immigrants | Vietnam | 27.1 /100 | #199 | Fair 2.4% |
| Peruvians | 27.1 /100 | #200 | Fair 2.4% |
| Immigrants | Uganda | 26.0 /100 | #201 | Fair 2.4% |
| German Russians | 25.7 /100 | #202 | Fair 2.4% |
| French Canadians | 24.7 /100 | #203 | Fair 2.4% |
| Ecuadorians | 24.5 /100 | #204 | Fair 2.4% |
| Immigrants | Afghanistan | 24.2 /100 | #205 | Fair 2.4% |
| Koreans | 24.1 /100 | #206 | Fair 2.4% |
| Whites/Caucasians | 22.6 /100 | #207 | Fair 2.4% |
| Immigrants | Kenya | 20.3 /100 | #208 | Fair 2.4% |
| Immigrants | Peru | 19.3 /100 | #209 | Poor 2.4% |