Immigrants from Peru vs Immigrants from Bangladesh Divorced or Separated
COMPARE
Immigrants from Peru
Immigrants from Bangladesh
Divorced or Separated
Divorced or Separated Comparison
Immigrants from Peru
Immigrants from Bangladesh
12.0%
DIVORCED OR SEPARATED
57.0/ 100
METRIC RATING
169th/ 347
METRIC RANK
11.0%
DIVORCED OR SEPARATED
100.0/ 100
METRIC RATING
27th/ 347
METRIC RANK
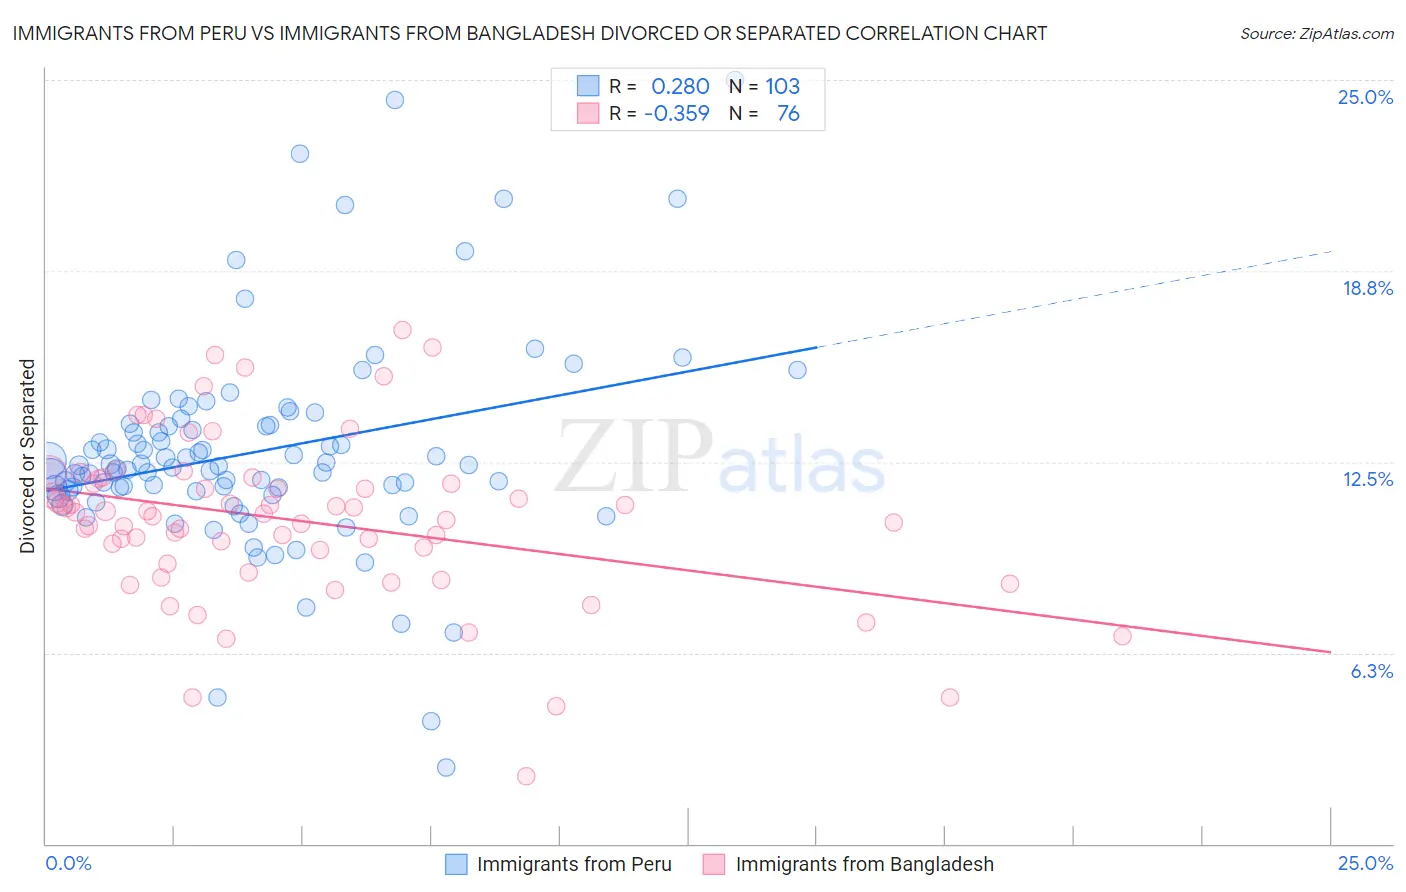
Immigrants from Peru vs Immigrants from Bangladesh Divorced or Separated Correlation Chart
The statistical analysis conducted on geographies consisting of 328,793,574 people shows a weak positive correlation between the proportion of Immigrants from Peru and percentage of population currently divorced or separated in the United States with a correlation coefficient (R) of 0.280 and weighted average of 12.0%. Similarly, the statistical analysis conducted on geographies consisting of 203,592,218 people shows a mild negative correlation between the proportion of Immigrants from Bangladesh and percentage of population currently divorced or separated in the United States with a correlation coefficient (R) of -0.359 and weighted average of 11.0%, a difference of 9.7%.
Divorced or Separated Correlation Summary
| Measurement | Immigrants from Peru | Immigrants from Bangladesh |
| Minimum | 2.5% | 2.2% |
| Maximum | 25.0% | 16.8% |
| Range | 22.5% | 14.6% |
| Mean | 12.8% | 10.6% |
| Median | 12.4% | 10.8% |
| Interquartile 25% (IQ1) | 11.6% | 9.4% |
| Interquartile 75% (IQ3) | 13.7% | 11.9% |
| Interquartile Range (IQR) | 2.1% | 2.5% |
| Standard Deviation (Sample) | 3.5% | 2.7% |
| Standard Deviation (Population) | 3.5% | 2.7% |
Similar Demographics by Divorced or Separated
Demographics Similar to Immigrants from Peru by Divorced or Separated
In terms of divorced or separated, the demographic groups most similar to Immigrants from Peru are Serbian (12.0%, a difference of 0.0%), Mexican American Indian (12.0%, a difference of 0.040%), Ethiopian (12.0%, a difference of 0.050%), Tohono O'odham (12.0%, a difference of 0.12%), and Costa Rican (12.0%, a difference of 0.13%).
| Demographics | Rating | Rank | Divorced or Separated |
| Samoans | 64.3 /100 | #162 | Good 12.0% |
| Navajo | 63.9 /100 | #163 | Good 12.0% |
| Swiss | 63.6 /100 | #164 | Good 12.0% |
| German Russians | 61.8 /100 | #165 | Good 12.0% |
| Tohono O'odham | 60.4 /100 | #166 | Good 12.0% |
| Ethiopians | 58.5 /100 | #167 | Average 12.0% |
| Serbians | 57.1 /100 | #168 | Average 12.0% |
| Immigrants | Peru | 57.0 /100 | #169 | Average 12.0% |
| Mexican American Indians | 55.8 /100 | #170 | Average 12.0% |
| Costa Ricans | 53.3 /100 | #171 | Average 12.0% |
| Immigrants | Mexico | 53.2 /100 | #172 | Average 12.0% |
| Immigrants | Moldova | 50.4 /100 | #173 | Average 12.1% |
| Hawaiians | 50.0 /100 | #174 | Average 12.1% |
| Immigrants | Sierra Leone | 50.0 /100 | #175 | Average 12.1% |
| Pennsylvania Germans | 48.9 /100 | #176 | Average 12.1% |
Demographics Similar to Immigrants from Bangladesh by Divorced or Separated
In terms of divorced or separated, the demographic groups most similar to Immigrants from Bangladesh are Immigrants from Malaysia (11.0%, a difference of 0.030%), Armenian (11.0%, a difference of 0.10%), Immigrants from Indonesia (10.9%, a difference of 0.44%), Immigrants from Ireland (11.0%, a difference of 0.62%), and Mongolian (11.1%, a difference of 0.92%).
| Demographics | Rating | Rank | Divorced or Separated |
| Burmese | 100.0 /100 | #20 | Exceptional 10.7% |
| Immigrants | Asia | 100.0 /100 | #21 | Exceptional 10.7% |
| Vietnamese | 100.0 /100 | #22 | Exceptional 10.8% |
| Immigrants | Pakistan | 100.0 /100 | #23 | Exceptional 10.8% |
| Immigrants | Sri Lanka | 100.0 /100 | #24 | Exceptional 10.8% |
| Iranians | 100.0 /100 | #25 | Exceptional 10.8% |
| Immigrants | Indonesia | 100.0 /100 | #26 | Exceptional 10.9% |
| Immigrants | Bangladesh | 100.0 /100 | #27 | Exceptional 11.0% |
| Immigrants | Malaysia | 100.0 /100 | #28 | Exceptional 11.0% |
| Armenians | 100.0 /100 | #29 | Exceptional 11.0% |
| Immigrants | Ireland | 100.0 /100 | #30 | Exceptional 11.0% |
| Mongolians | 100.0 /100 | #31 | Exceptional 11.1% |
| Tongans | 100.0 /100 | #32 | Exceptional 11.1% |
| Egyptians | 100.0 /100 | #33 | Exceptional 11.1% |
| Immigrants | Uzbekistan | 100.0 /100 | #34 | Exceptional 11.1% |