Immigrants from Panama vs Somali Currently Married
COMPARE
Immigrants from Panama
Somali
Currently Married
Currently Married Comparison
Immigrants from Panama
Somalis
44.9%
CURRENTLY MARRIED
1.5/ 100
METRIC RATING
231st/ 347
METRIC RANK
41.5%
CURRENTLY MARRIED
0.0/ 100
METRIC RATING
312th/ 347
METRIC RANK
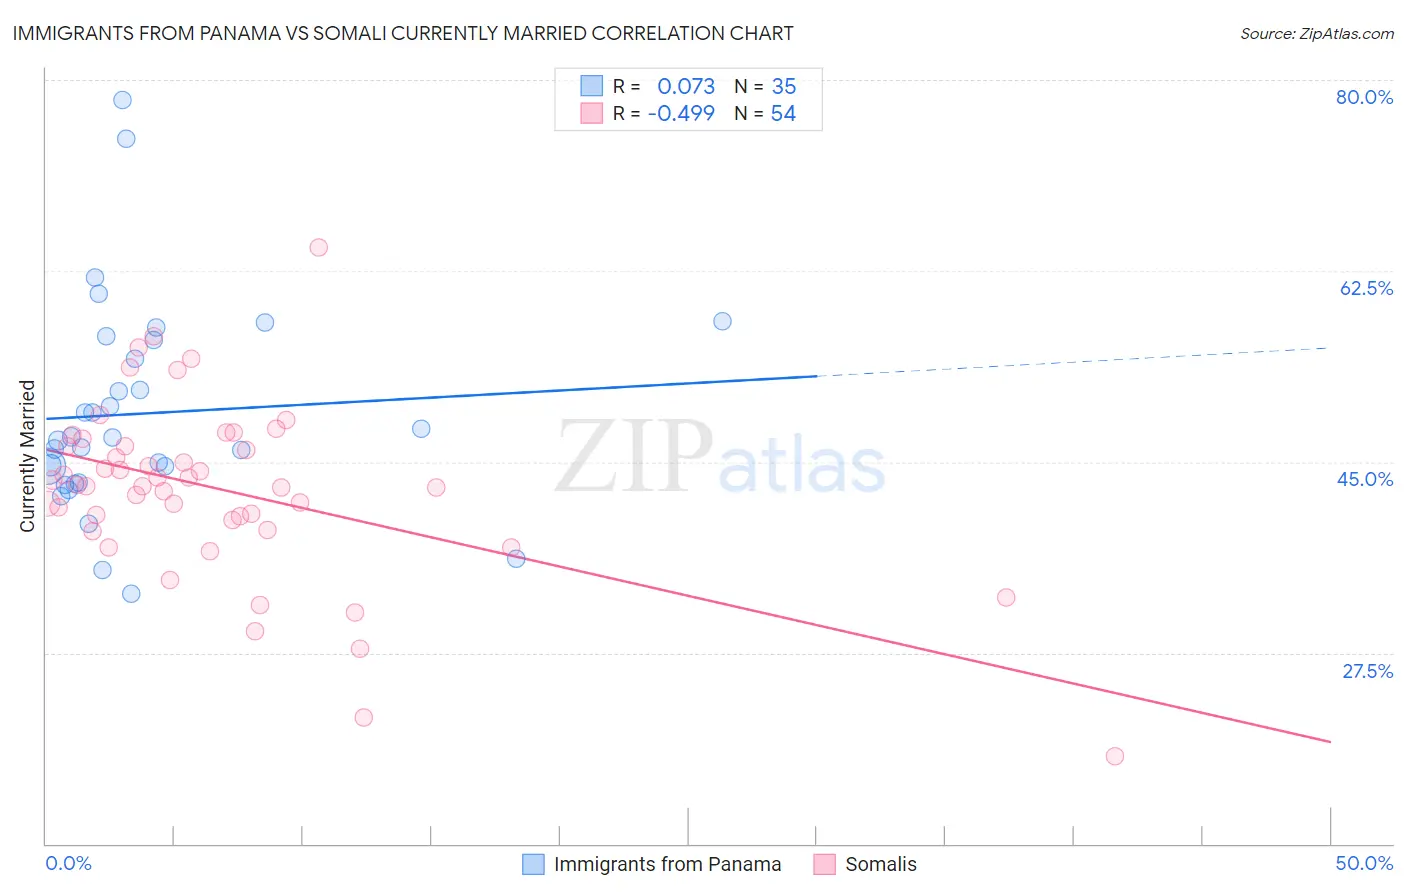
Immigrants from Panama vs Somali Currently Married Correlation Chart
The statistical analysis conducted on geographies consisting of 221,180,776 people shows a slight positive correlation between the proportion of Immigrants from Panama and percentage of population currently married in the United States with a correlation coefficient (R) of 0.073 and weighted average of 44.9%. Similarly, the statistical analysis conducted on geographies consisting of 99,327,030 people shows a moderate negative correlation between the proportion of Somalis and percentage of population currently married in the United States with a correlation coefficient (R) of -0.499 and weighted average of 41.5%, a difference of 8.2%.
Currently Married Correlation Summary
| Measurement | Immigrants from Panama | Somali |
| Minimum | 32.9% | 18.0% |
| Maximum | 78.2% | 64.7% |
| Range | 45.3% | 46.7% |
| Mean | 49.5% | 42.5% |
| Median | 47.2% | 42.8% |
| Interquartile 25% (IQ1) | 43.1% | 39.7% |
| Interquartile 75% (IQ3) | 56.2% | 46.5% |
| Interquartile Range (IQR) | 13.1% | 6.8% |
| Standard Deviation (Sample) | 9.7% | 8.1% |
| Standard Deviation (Population) | 9.6% | 8.1% |
Similar Demographics by Currently Married
Demographics Similar to Immigrants from Panama by Currently Married
In terms of currently married, the demographic groups most similar to Immigrants from Panama are Immigrants from Kenya (44.9%, a difference of 0.040%), Cree (44.9%, a difference of 0.080%), Nepalese (44.7%, a difference of 0.26%), Spanish American (45.0%, a difference of 0.27%), and Immigrants from Uruguay (45.0%, a difference of 0.27%).
| Demographics | Rating | Rank | Currently Married |
| Immigrants | Uganda | 2.2 /100 | #224 | Tragic 45.0% |
| French American Indians | 2.2 /100 | #225 | Tragic 45.0% |
| Comanche | 2.1 /100 | #226 | Tragic 45.0% |
| Spanish Americans | 2.1 /100 | #227 | Tragic 45.0% |
| Immigrants | Uruguay | 2.0 /100 | #228 | Tragic 45.0% |
| Cree | 1.7 /100 | #229 | Tragic 44.9% |
| Immigrants | Kenya | 1.6 /100 | #230 | Tragic 44.9% |
| Immigrants | Panama | 1.5 /100 | #231 | Tragic 44.9% |
| Nepalese | 1.2 /100 | #232 | Tragic 44.7% |
| Immigrants | Saudi Arabia | 1.1 /100 | #233 | Tragic 44.7% |
| Iroquois | 1.1 /100 | #234 | Tragic 44.7% |
| Alaskan Athabascans | 0.9 /100 | #235 | Tragic 44.6% |
| Cubans | 0.9 /100 | #236 | Tragic 44.6% |
| Seminole | 0.9 /100 | #237 | Tragic 44.6% |
| Moroccans | 0.9 /100 | #238 | Tragic 44.6% |
Demographics Similar to Somalis by Currently Married
In terms of currently married, the demographic groups most similar to Somalis are Trinidadian and Tobagonian (41.5%, a difference of 0.18%), Jamaican (41.4%, a difference of 0.29%), Guyanese (41.6%, a difference of 0.33%), West Indian (41.3%, a difference of 0.36%), and Inupiat (41.3%, a difference of 0.45%).
| Demographics | Rating | Rank | Currently Married |
| Immigrants | Trinidad and Tobago | 0.0 /100 | #305 | Tragic 41.9% |
| Immigrants | Guyana | 0.0 /100 | #306 | Tragic 41.9% |
| Africans | 0.0 /100 | #307 | Tragic 41.8% |
| Immigrants | Belize | 0.0 /100 | #308 | Tragic 41.8% |
| Immigrants | Liberia | 0.0 /100 | #309 | Tragic 41.8% |
| Guyanese | 0.0 /100 | #310 | Tragic 41.6% |
| Trinidadians and Tobagonians | 0.0 /100 | #311 | Tragic 41.5% |
| Somalis | 0.0 /100 | #312 | Tragic 41.5% |
| Jamaicans | 0.0 /100 | #313 | Tragic 41.4% |
| West Indians | 0.0 /100 | #314 | Tragic 41.3% |
| Inupiat | 0.0 /100 | #315 | Tragic 41.3% |
| Immigrants | Caribbean | 0.0 /100 | #316 | Tragic 41.3% |
| Haitians | 0.0 /100 | #317 | Tragic 41.3% |
| Bahamians | 0.0 /100 | #318 | Tragic 41.2% |
| Immigrants | Somalia | 0.0 /100 | #319 | Tragic 41.2% |