Immigrants from Pakistan vs Irish Births to Unmarried Women
COMPARE
Immigrants from Pakistan
Irish
Births to Unmarried Women
Births to Unmarried Women Comparison
Immigrants from Pakistan
Irish
27.2%
BIRTHS TO UNMARRIED WOMEN
99.8/ 100
METRIC RATING
34th/ 347
METRIC RANK
32.2%
BIRTHS TO UNMARRIED WOMEN
32.4/ 100
METRIC RATING
191st/ 347
METRIC RANK
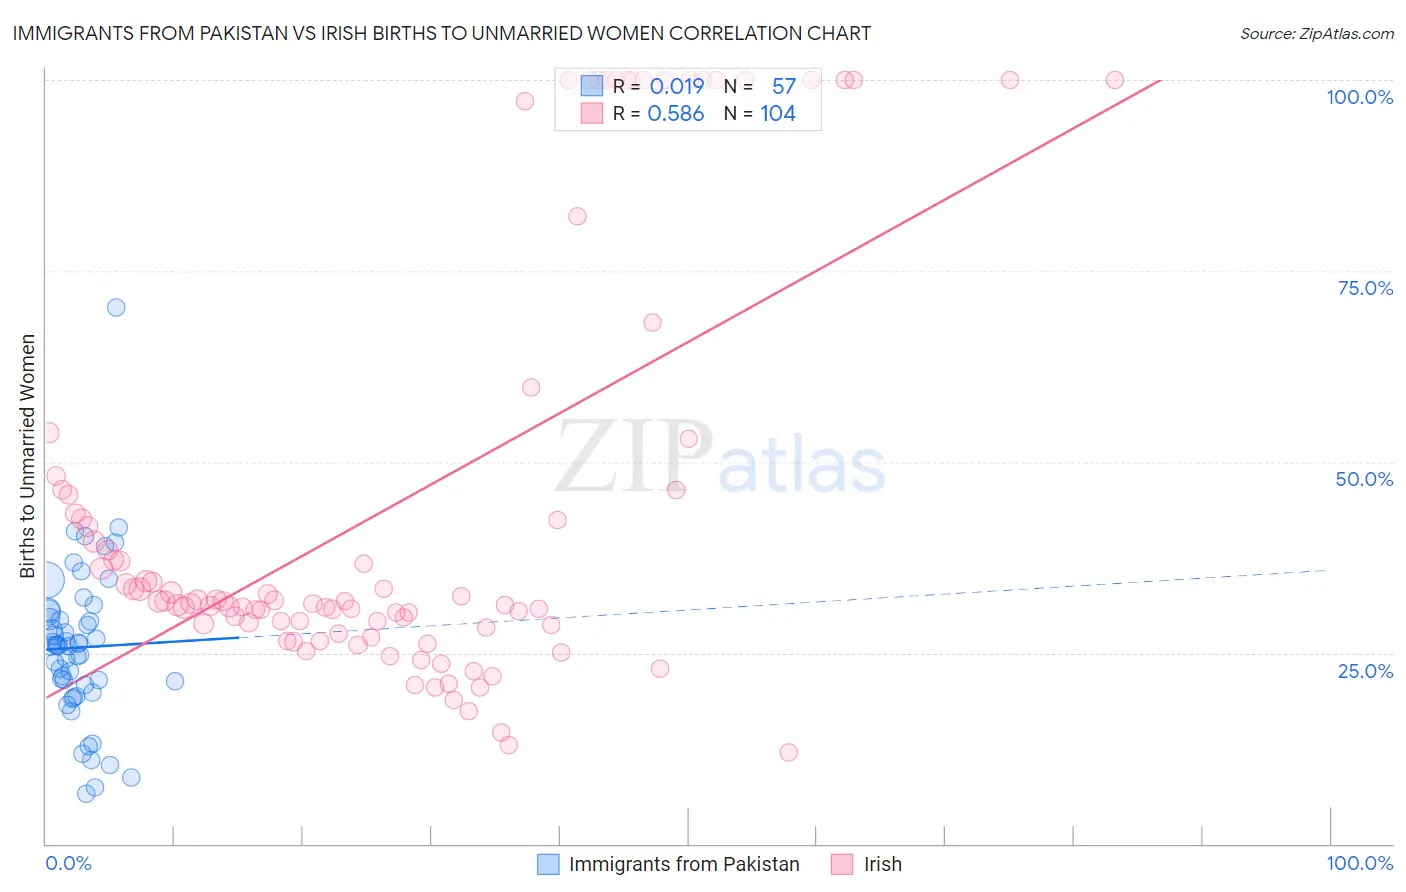
Immigrants from Pakistan vs Irish Births to Unmarried Women Correlation Chart
The statistical analysis conducted on geographies consisting of 268,631,463 people shows no correlation between the proportion of Immigrants from Pakistan and percentage of births to unmarried women in the United States with a correlation coefficient (R) of 0.019 and weighted average of 27.2%. Similarly, the statistical analysis conducted on geographies consisting of 510,434,207 people shows a substantial positive correlation between the proportion of Irish and percentage of births to unmarried women in the United States with a correlation coefficient (R) of 0.586 and weighted average of 32.2%, a difference of 18.6%.
Births to Unmarried Women Correlation Summary
| Measurement | Immigrants from Pakistan | Irish |
| Minimum | 6.6% | 11.9% |
| Maximum | 70.2% | 100.0% |
| Range | 63.6% | 88.1% |
| Mean | 25.7% | 44.6% |
| Median | 26.0% | 31.8% |
| Interquartile 25% (IQ1) | 20.3% | 28.8% |
| Interquartile 75% (IQ3) | 29.9% | 46.3% |
| Interquartile Range (IQR) | 9.6% | 17.6% |
| Standard Deviation (Sample) | 10.3% | 28.0% |
| Standard Deviation (Population) | 10.3% | 27.9% |
Similar Demographics by Births to Unmarried Women
Demographics Similar to Immigrants from Pakistan by Births to Unmarried Women
In terms of births to unmarried women, the demographic groups most similar to Immigrants from Pakistan are Immigrants from Sri Lanka (27.2%, a difference of 0.040%), Immigrants from Ireland (27.2%, a difference of 0.070%), Immigrants from Russia (27.1%, a difference of 0.11%), Immigrants from Iraq (27.1%, a difference of 0.14%), and Immigrants from Western Asia (27.2%, a difference of 0.15%).
| Demographics | Rating | Rank | Births to Unmarried Women |
| Immigrants | Asia | 99.9 /100 | #27 | Exceptional 26.8% |
| Okinawans | 99.8 /100 | #28 | Exceptional 26.9% |
| Cypriots | 99.8 /100 | #29 | Exceptional 27.0% |
| Bulgarians | 99.8 /100 | #30 | Exceptional 27.1% |
| Immigrants | Iraq | 99.8 /100 | #31 | Exceptional 27.1% |
| Immigrants | Russia | 99.8 /100 | #32 | Exceptional 27.1% |
| Immigrants | Sri Lanka | 99.8 /100 | #33 | Exceptional 27.2% |
| Immigrants | Pakistan | 99.8 /100 | #34 | Exceptional 27.2% |
| Immigrants | Ireland | 99.7 /100 | #35 | Exceptional 27.2% |
| Immigrants | Western Asia | 99.7 /100 | #36 | Exceptional 27.2% |
| Immigrants | Ukraine | 99.7 /100 | #37 | Exceptional 27.2% |
| Immigrants | Moldova | 99.7 /100 | #38 | Exceptional 27.3% |
| Immigrants | Malaysia | 99.7 /100 | #39 | Exceptional 27.4% |
| Turks | 99.6 /100 | #40 | Exceptional 27.4% |
| Iraqis | 99.6 /100 | #41 | Exceptional 27.6% |
Demographics Similar to Irish by Births to Unmarried Women
In terms of births to unmarried women, the demographic groups most similar to Irish are Tlingit-Haida (32.2%, a difference of 0.020%), Colombian (32.2%, a difference of 0.050%), Fijian (32.3%, a difference of 0.14%), Immigrants from Kenya (32.1%, a difference of 0.46%), and Osage (32.1%, a difference of 0.49%).
| Demographics | Rating | Rank | Births to Unmarried Women |
| Immigrants | South America | 40.7 /100 | #184 | Average 32.0% |
| Germans | 39.5 /100 | #185 | Fair 32.0% |
| Welsh | 38.2 /100 | #186 | Fair 32.0% |
| Czechoslovakians | 38.0 /100 | #187 | Fair 32.0% |
| Osage | 37.1 /100 | #188 | Fair 32.1% |
| Immigrants | Kenya | 36.9 /100 | #189 | Fair 32.1% |
| Tlingit-Haida | 32.6 /100 | #190 | Fair 32.2% |
| Irish | 32.4 /100 | #191 | Fair 32.2% |
| Colombians | 31.9 /100 | #192 | Fair 32.2% |
| Fijians | 31.1 /100 | #193 | Fair 32.3% |
| Sudanese | 27.3 /100 | #194 | Fair 32.4% |
| Samoans | 21.9 /100 | #195 | Fair 32.6% |
| Immigrants | Colombia | 21.7 /100 | #196 | Fair 32.6% |
| Immigrants | Immigrants | 20.6 /100 | #197 | Fair 32.7% |
| Costa Ricans | 20.3 /100 | #198 | Fair 32.7% |