Immigrants from Pakistan vs Asian Married-couple Households
COMPARE
Immigrants from Pakistan
Asian
Married-couple Households
Married-couple Households Comparison
Immigrants from Pakistan
Asians
50.1%
MARRIED-COUPLE HOUSEHOLDS
100.0/ 100
METRIC RATING
11th/ 347
METRIC RANK
49.5%
MARRIED-COUPLE HOUSEHOLDS
99.9/ 100
METRIC RATING
22nd/ 347
METRIC RANK
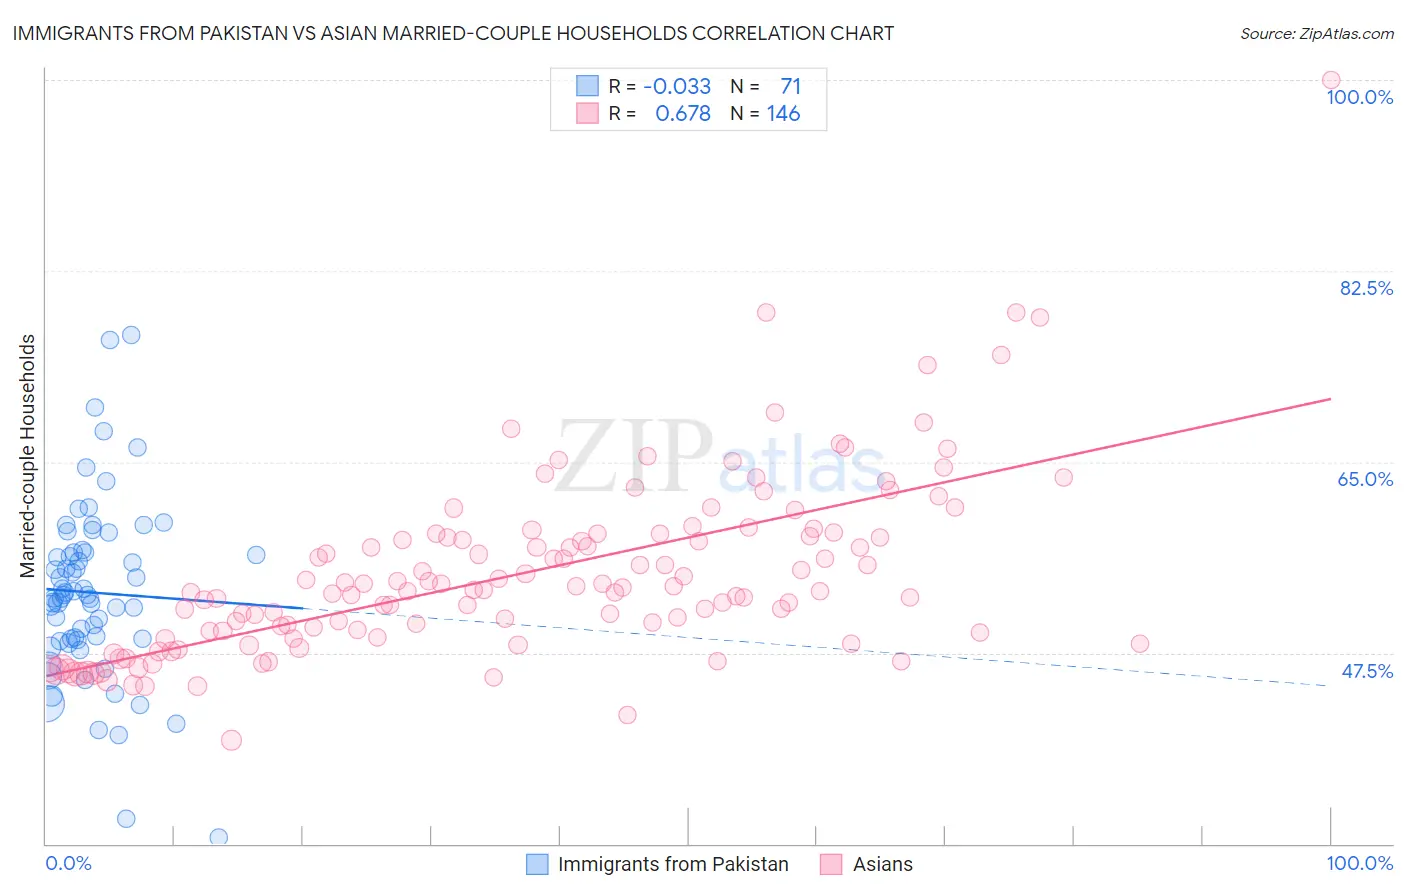
Immigrants from Pakistan vs Asian Married-couple Households Correlation Chart
The statistical analysis conducted on geographies consisting of 283,790,790 people shows no correlation between the proportion of Immigrants from Pakistan and percentage of married-couple family households in the United States with a correlation coefficient (R) of -0.033 and weighted average of 50.1%. Similarly, the statistical analysis conducted on geographies consisting of 550,235,479 people shows a significant positive correlation between the proportion of Asians and percentage of married-couple family households in the United States with a correlation coefficient (R) of 0.678 and weighted average of 49.5%, a difference of 1.3%.
Married-couple Households Correlation Summary
| Measurement | Immigrants from Pakistan | Asian |
| Minimum | 30.6% | 39.5% |
| Maximum | 76.6% | 100.0% |
| Range | 46.0% | 60.5% |
| Mean | 53.0% | 54.8% |
| Median | 52.8% | 53.3% |
| Interquartile 25% (IQ1) | 48.7% | 49.4% |
| Interquartile 75% (IQ3) | 56.7% | 58.2% |
| Interquartile Range (IQR) | 8.1% | 8.8% |
| Standard Deviation (Sample) | 8.2% | 8.3% |
| Standard Deviation (Population) | 8.2% | 8.3% |
Demographics Similar to Immigrants from Pakistan and Asians by Married-couple Households
In terms of married-couple households, the demographic groups most similar to Immigrants from Pakistan are Swiss (49.9%, a difference of 0.37%), Pennsylvania German (50.4%, a difference of 0.44%), Chinese (50.4%, a difference of 0.44%), Immigrants from Korea (49.9%, a difference of 0.54%), and Burmese (49.8%, a difference of 0.66%). Similarly, the demographic groups most similar to Asians are Dutch (49.5%, a difference of 0.010%), Czech (49.4%, a difference of 0.090%), Norwegian (49.5%, a difference of 0.11%), European (49.6%, a difference of 0.17%), and Scandinavian (49.6%, a difference of 0.17%).
| Demographics | Rating | Rank | Married-couple Households |
| Danes | 100.0 /100 | #6 | Exceptional 51.1% |
| Filipinos | 100.0 /100 | #7 | Exceptional 51.0% |
| Immigrants | South Central Asia | 100.0 /100 | #8 | Exceptional 50.6% |
| Pennsylvania Germans | 100.0 /100 | #9 | Exceptional 50.4% |
| Chinese | 100.0 /100 | #10 | Exceptional 50.4% |
| Immigrants | Pakistan | 100.0 /100 | #11 | Exceptional 50.1% |
| Swiss | 100.0 /100 | #12 | Exceptional 49.9% |
| Immigrants | Korea | 100.0 /100 | #13 | Exceptional 49.9% |
| Burmese | 100.0 /100 | #14 | Exceptional 49.8% |
| Koreans | 99.9 /100 | #15 | Exceptional 49.7% |
| Swedes | 99.9 /100 | #16 | Exceptional 49.7% |
| Immigrants | Hong Kong | 99.9 /100 | #17 | Exceptional 49.6% |
| English | 99.9 /100 | #18 | Exceptional 49.6% |
| Europeans | 99.9 /100 | #19 | Exceptional 49.6% |
| Scandinavians | 99.9 /100 | #20 | Exceptional 49.6% |
| Norwegians | 99.9 /100 | #21 | Exceptional 49.5% |
| Asians | 99.9 /100 | #22 | Exceptional 49.5% |
| Dutch | 99.9 /100 | #23 | Exceptional 49.5% |
| Czechs | 99.9 /100 | #24 | Exceptional 49.4% |
| Immigrants | Philippines | 99.9 /100 | #25 | Exceptional 49.3% |
| Immigrants | Scotland | 99.8 /100 | #26 | Exceptional 49.3% |