Immigrants from Northern Africa vs Bahamian Single Mother Households
COMPARE
Immigrants from Northern Africa
Bahamian
Single Mother Households
Single Mother Households Comparison
Immigrants from Northern Africa
Bahamians
6.2%
SINGLE MOTHER HOUSEHOLDS
68.0/ 100
METRIC RATING
164th/ 347
METRIC RANK
8.3%
SINGLE MOTHER HOUSEHOLDS
0.0/ 100
METRIC RATING
320th/ 347
METRIC RANK
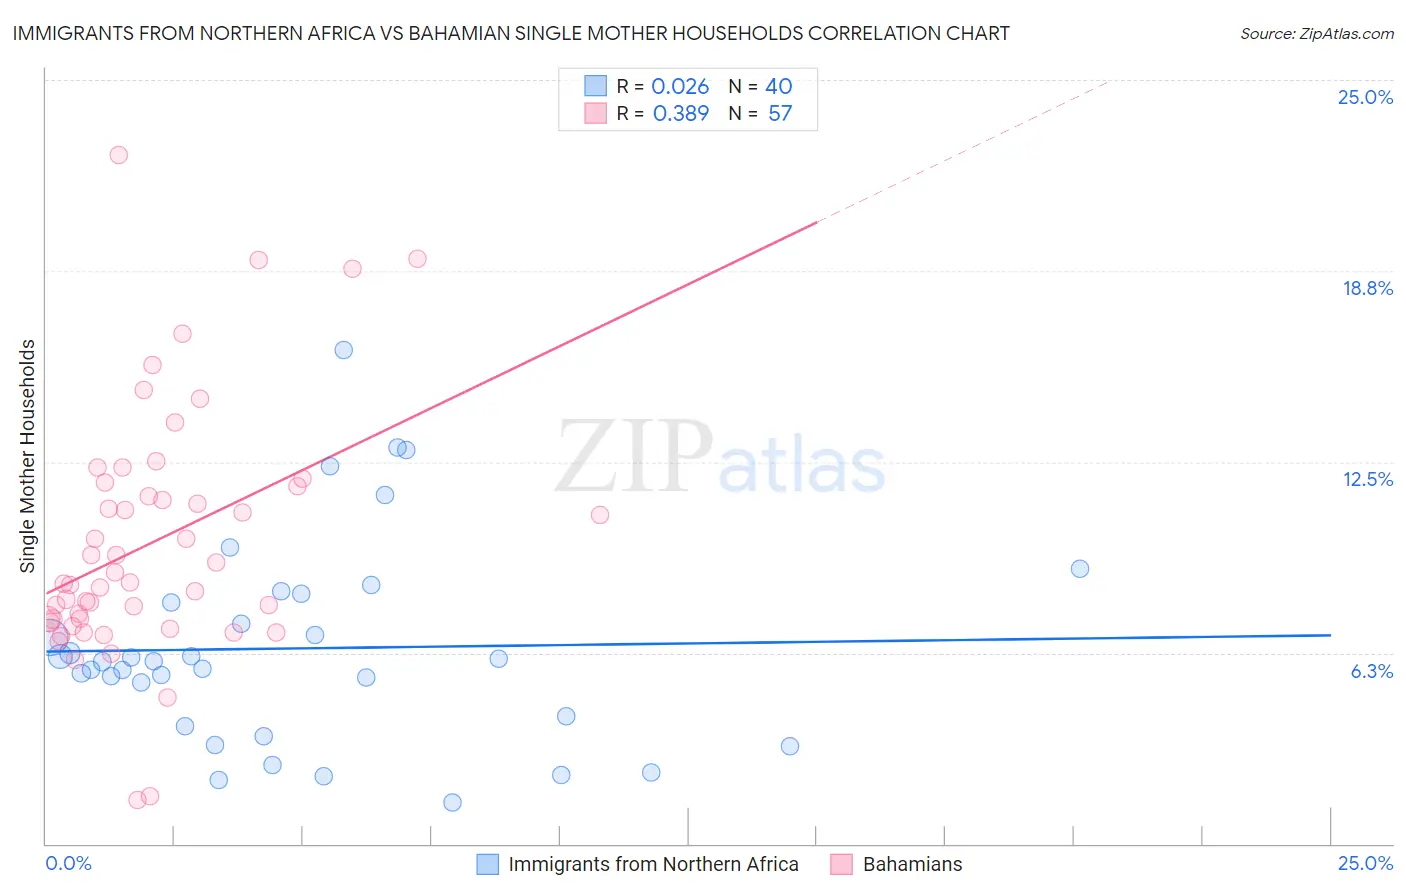
Immigrants from Northern Africa vs Bahamian Single Mother Households Correlation Chart
The statistical analysis conducted on geographies consisting of 320,525,361 people shows no correlation between the proportion of Immigrants from Northern Africa and percentage of single mother households in the United States with a correlation coefficient (R) of 0.026 and weighted average of 6.2%. Similarly, the statistical analysis conducted on geographies consisting of 112,454,075 people shows a mild positive correlation between the proportion of Bahamians and percentage of single mother households in the United States with a correlation coefficient (R) of 0.389 and weighted average of 8.3%, a difference of 33.5%.
Single Mother Households Correlation Summary
| Measurement | Immigrants from Northern Africa | Bahamian |
| Minimum | 1.3% | 1.4% |
| Maximum | 16.1% | 22.6% |
| Range | 14.8% | 21.1% |
| Mean | 6.4% | 9.9% |
| Median | 6.0% | 8.5% |
| Interquartile 25% (IQ1) | 4.0% | 7.3% |
| Interquartile 75% (IQ3) | 8.0% | 11.8% |
| Interquartile Range (IQR) | 4.0% | 4.5% |
| Standard Deviation (Sample) | 3.3% | 4.1% |
| Standard Deviation (Population) | 3.3% | 4.0% |
Similar Demographics by Single Mother Households
Demographics Similar to Immigrants from Northern Africa by Single Mother Households
In terms of single mother households, the demographic groups most similar to Immigrants from Northern Africa are Immigrants from Syria (6.2%, a difference of 0.070%), Alsatian (6.2%, a difference of 0.090%), Immigrants from Zimbabwe (6.2%, a difference of 0.25%), Sri Lankan (6.2%, a difference of 0.50%), and Immigrants from Germany (6.1%, a difference of 0.60%).
| Demographics | Rating | Rank | Single Mother Households |
| Chileans | 74.2 /100 | #157 | Good 6.1% |
| Celtics | 73.3 /100 | #158 | Good 6.1% |
| Yugoslavians | 73.1 /100 | #159 | Good 6.1% |
| Iraqis | 73.0 /100 | #160 | Good 6.1% |
| Immigrants | Germany | 72.4 /100 | #161 | Good 6.1% |
| Immigrants | Zimbabwe | 69.9 /100 | #162 | Good 6.2% |
| Alsatians | 68.7 /100 | #163 | Good 6.2% |
| Immigrants | Northern Africa | 68.0 /100 | #164 | Good 6.2% |
| Immigrants | Syria | 67.4 /100 | #165 | Good 6.2% |
| Sri Lankans | 63.9 /100 | #166 | Good 6.2% |
| Brazilians | 59.1 /100 | #167 | Average 6.2% |
| Immigrants | Chile | 58.3 /100 | #168 | Average 6.3% |
| Puget Sound Salish | 58.1 /100 | #169 | Average 6.3% |
| Immigrants | Oceania | 54.6 /100 | #170 | Average 6.3% |
| Afghans | 52.5 /100 | #171 | Average 6.3% |
Demographics Similar to Bahamians by Single Mother Households
In terms of single mother households, the demographic groups most similar to Bahamians are Jamaican (8.2%, a difference of 0.12%), Senegalese (8.2%, a difference of 0.23%), Immigrants from Senegal (8.3%, a difference of 0.24%), Pima (8.3%, a difference of 0.32%), and Immigrants from Honduras (8.2%, a difference of 0.80%).
| Demographics | Rating | Rank | Single Mother Households |
| Immigrants | Grenada | 0.0 /100 | #313 | Tragic 8.2% |
| Immigrants | Mexico | 0.0 /100 | #314 | Tragic 8.2% |
| Immigrants | Western Africa | 0.0 /100 | #315 | Tragic 8.2% |
| Africans | 0.0 /100 | #316 | Tragic 8.2% |
| Immigrants | Honduras | 0.0 /100 | #317 | Tragic 8.2% |
| Senegalese | 0.0 /100 | #318 | Tragic 8.2% |
| Jamaicans | 0.0 /100 | #319 | Tragic 8.2% |
| Bahamians | 0.0 /100 | #320 | Tragic 8.3% |
| Immigrants | Senegal | 0.0 /100 | #321 | Tragic 8.3% |
| Pima | 0.0 /100 | #322 | Tragic 8.3% |
| Haitians | 0.0 /100 | #323 | Tragic 8.3% |
| Immigrants | Jamaica | 0.0 /100 | #324 | Tragic 8.4% |
| Immigrants | Caribbean | 0.0 /100 | #325 | Tragic 8.4% |
| British West Indians | 0.0 /100 | #326 | Tragic 8.4% |
| Immigrants | Haiti | 0.0 /100 | #327 | Tragic 8.4% |